
North Shore Real Estate Market Reports
Monthly and quarterly sales data and insights for North and West Vancouver
![Market Update | Q3 [July - September] 2026](https://images.squarespace-cdn.com/content/v1/696842f509671f5970227182/1791337524804-XYN1KLE20D51AAUHL4DN/book-A-01.png)
Market Update | Q3 [July - September] 2026
September brought listings back to the North Shore, but not a clear direction. North Vancouver sales fell while West Vancouver rose, and condos stayed the weakest segment. Here's what the numbers mean heading into the rest of the year.
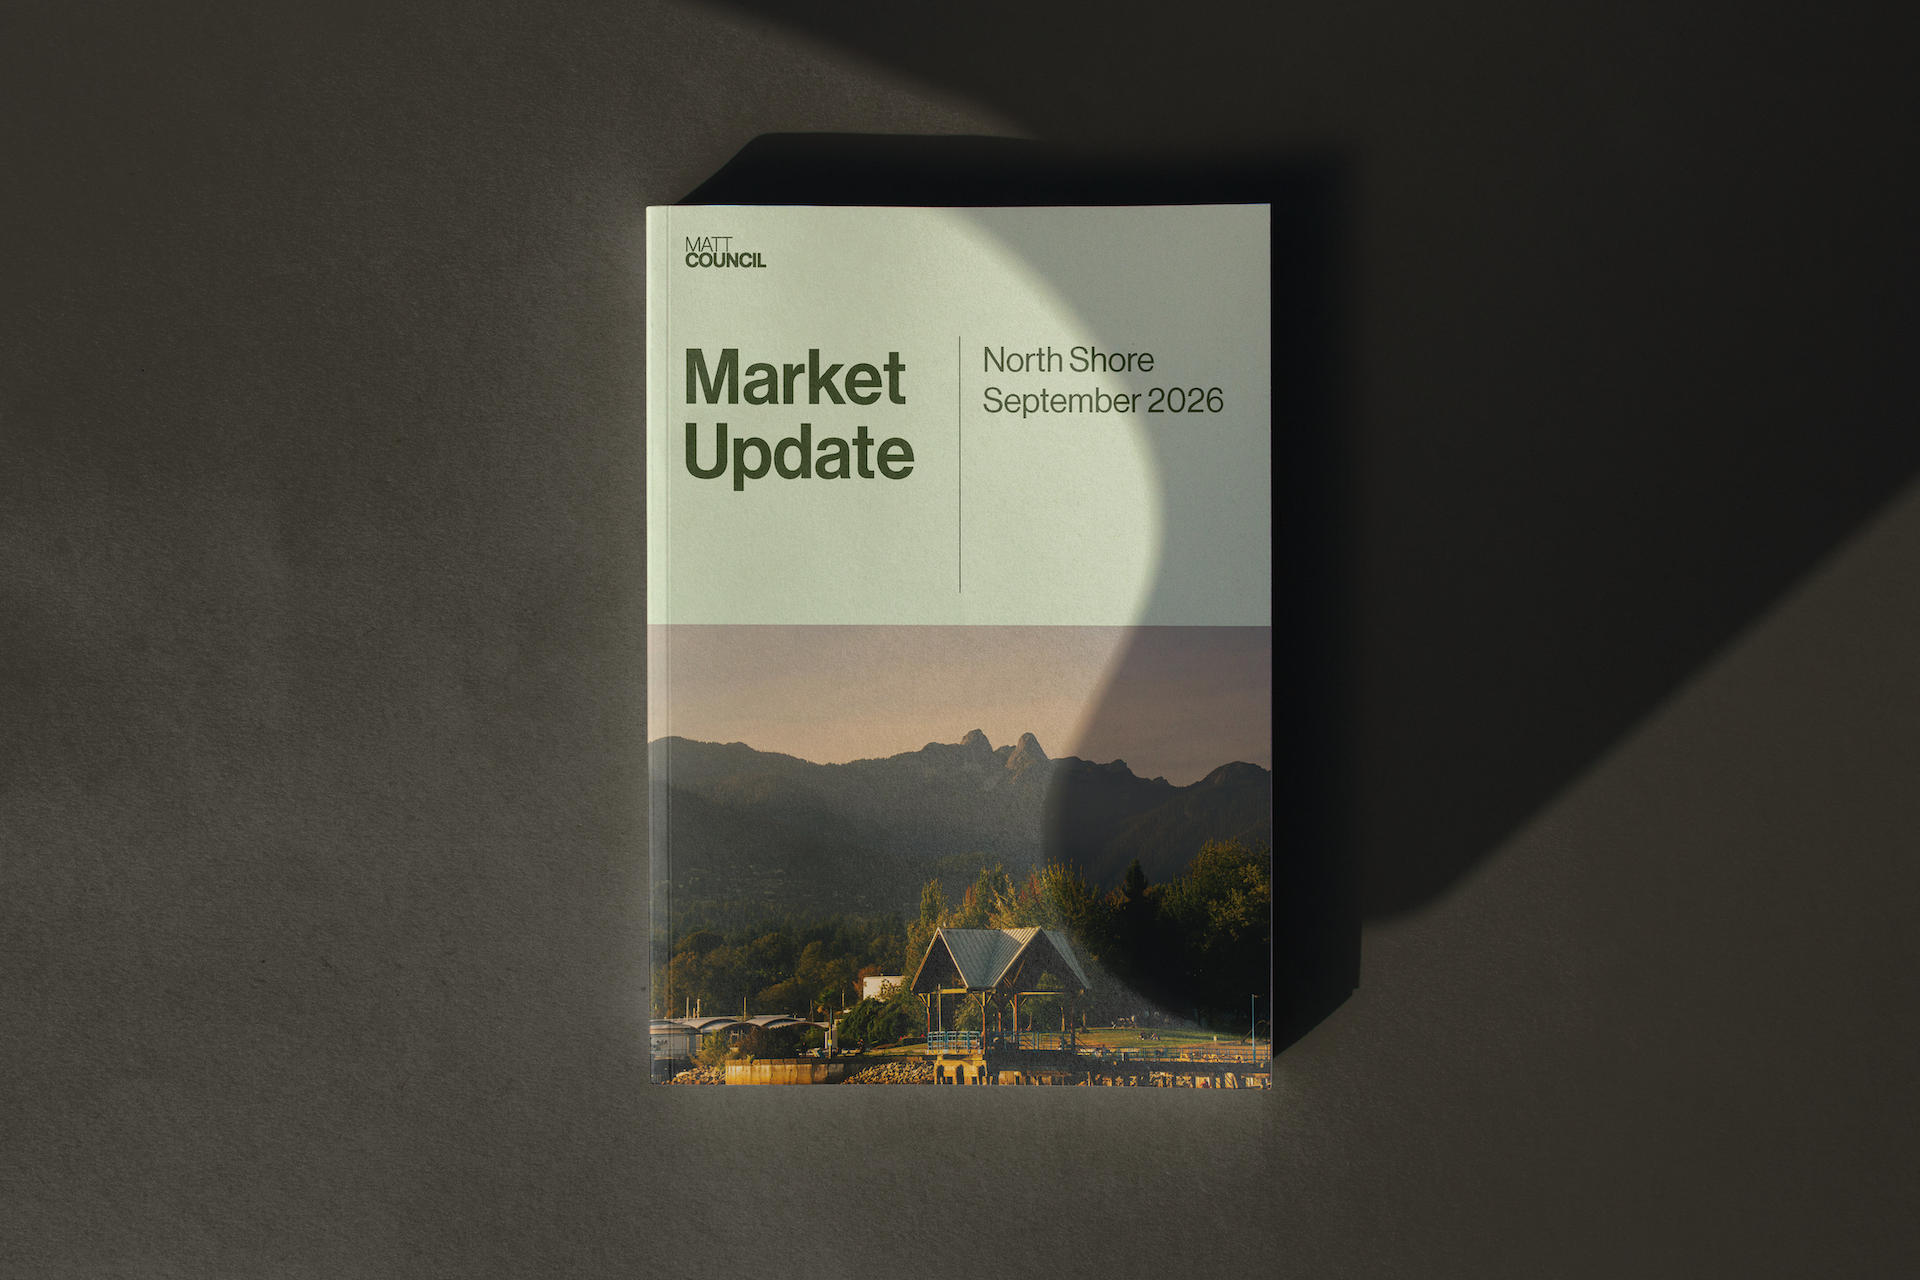
Market Update | September 2026
August brought another month of uneven activity to the North Shore, with North Vancouver holding steady, West Vancouver swinging sharply higher, and inventory continuing to shrink. Here's what the numbers mean heading into fall.
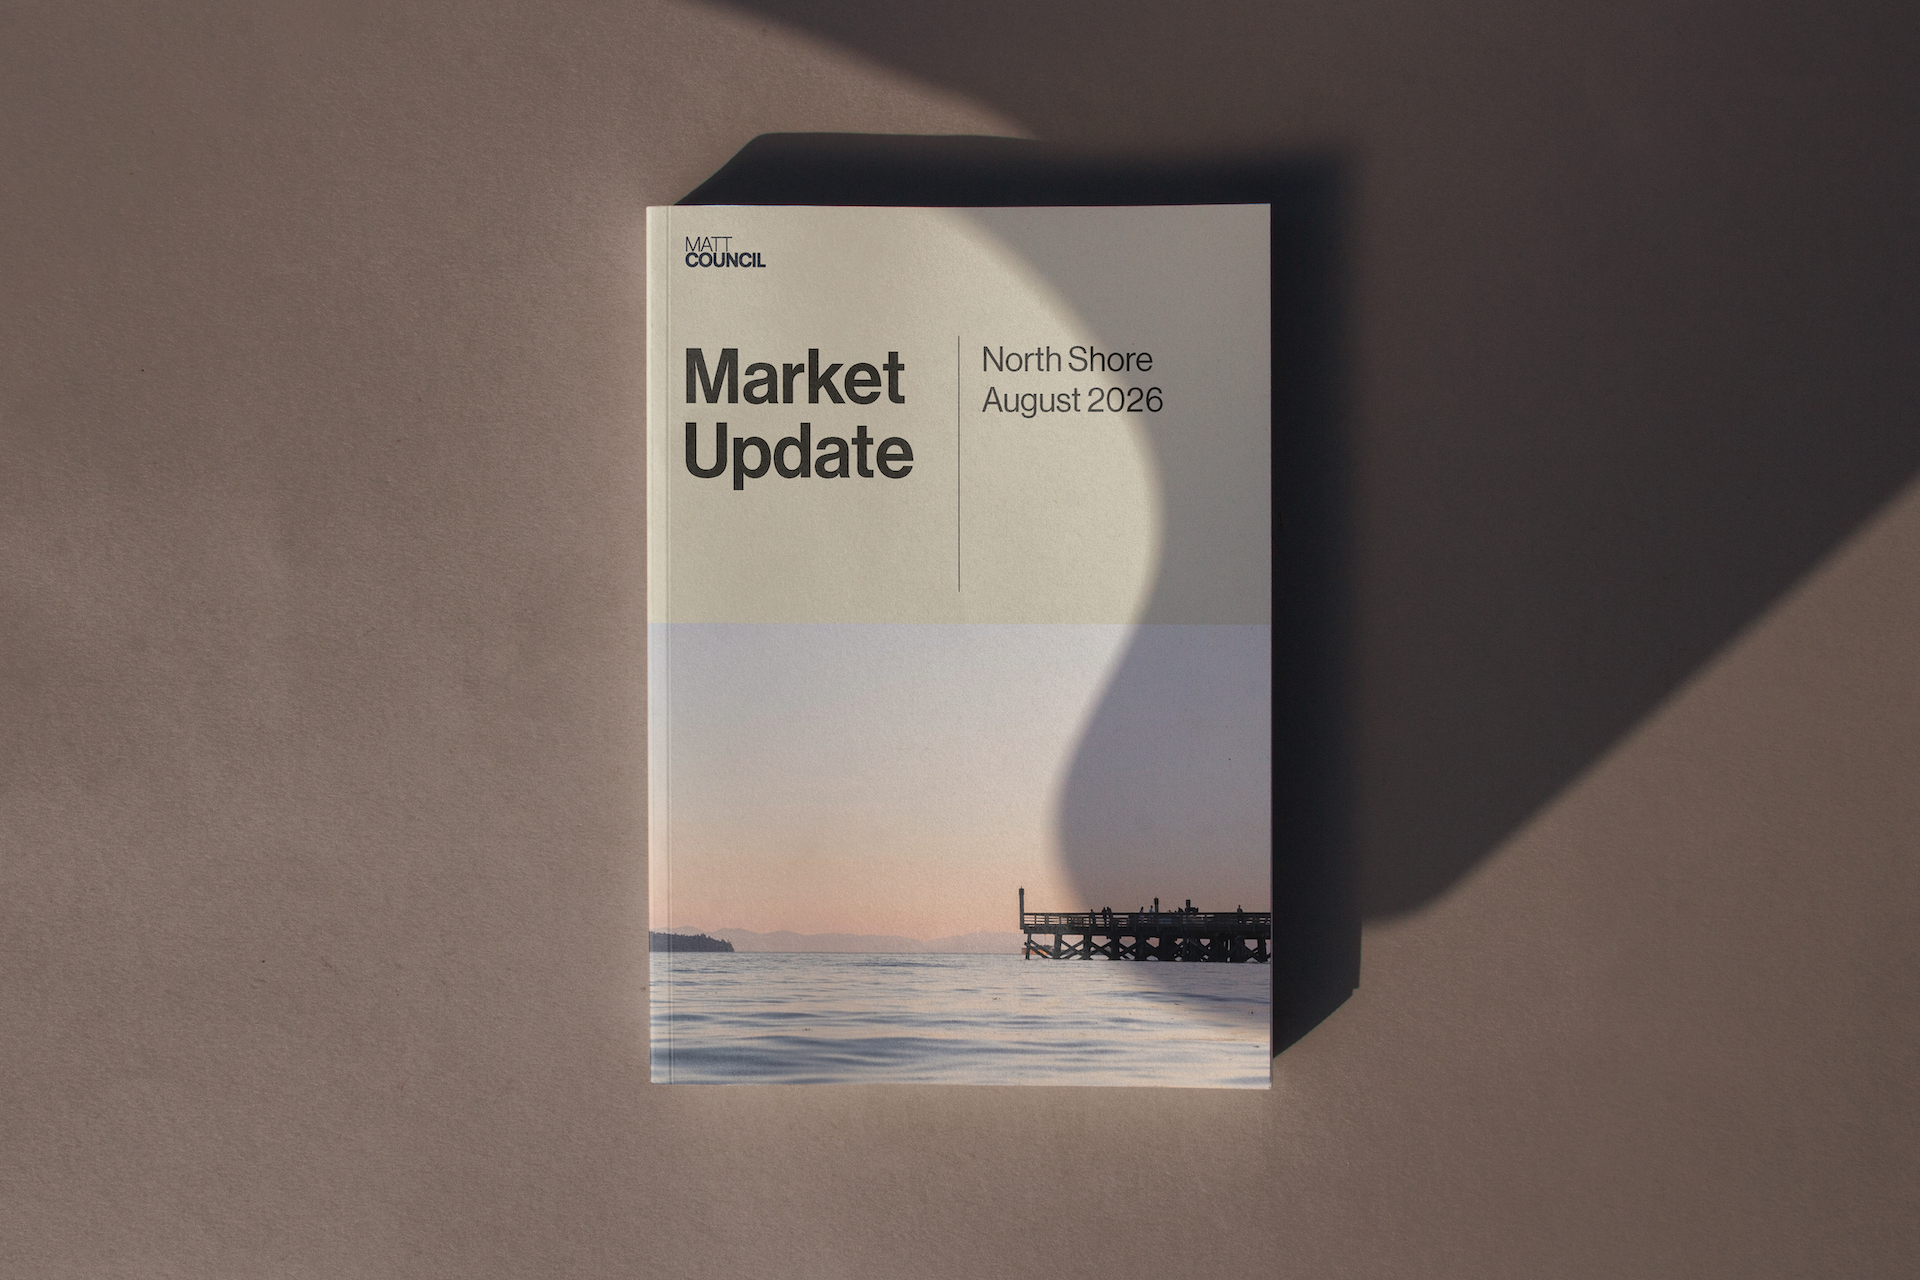
Market Update | August 2026
July brought a standoff to the North Shore: fewer sellers listing, fewer buyers closing, and both North and West Vancouver posting sales declines. Here's what the numbers show.
![Market Update | Q2 [April - June] 2026](https://images.squarespace-cdn.com/content/v1/696842f509671f5970227182/1783545904533-CUNVVA1R6PF4X7F7CC2W/full.png)
Market Update | Q2 [April - June] 2026
June brought a more balanced North Shore market, but it's shrinking inventory doing the work, not a jump in buyer confidence. Here's what the numbers, including a widening gap in how fast homes are selling in each area, mean if you're buying or selling this summer.
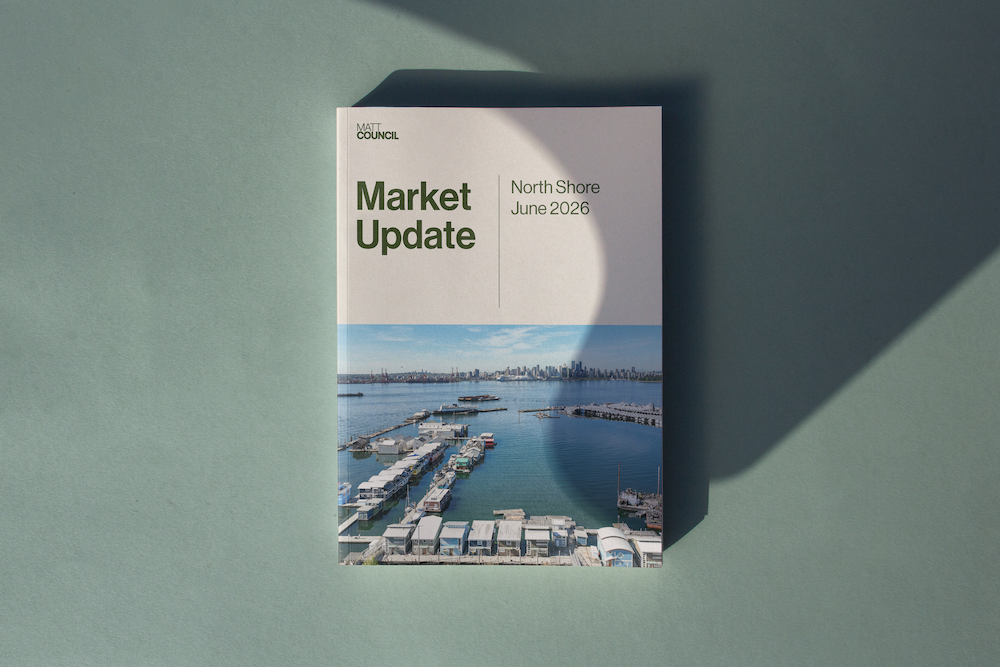
Market Update | June 2026
May shows a highly selective spring market. While North Van sales improved from April, West Van slowed and condo buyers focus heavily on risk mitigation.
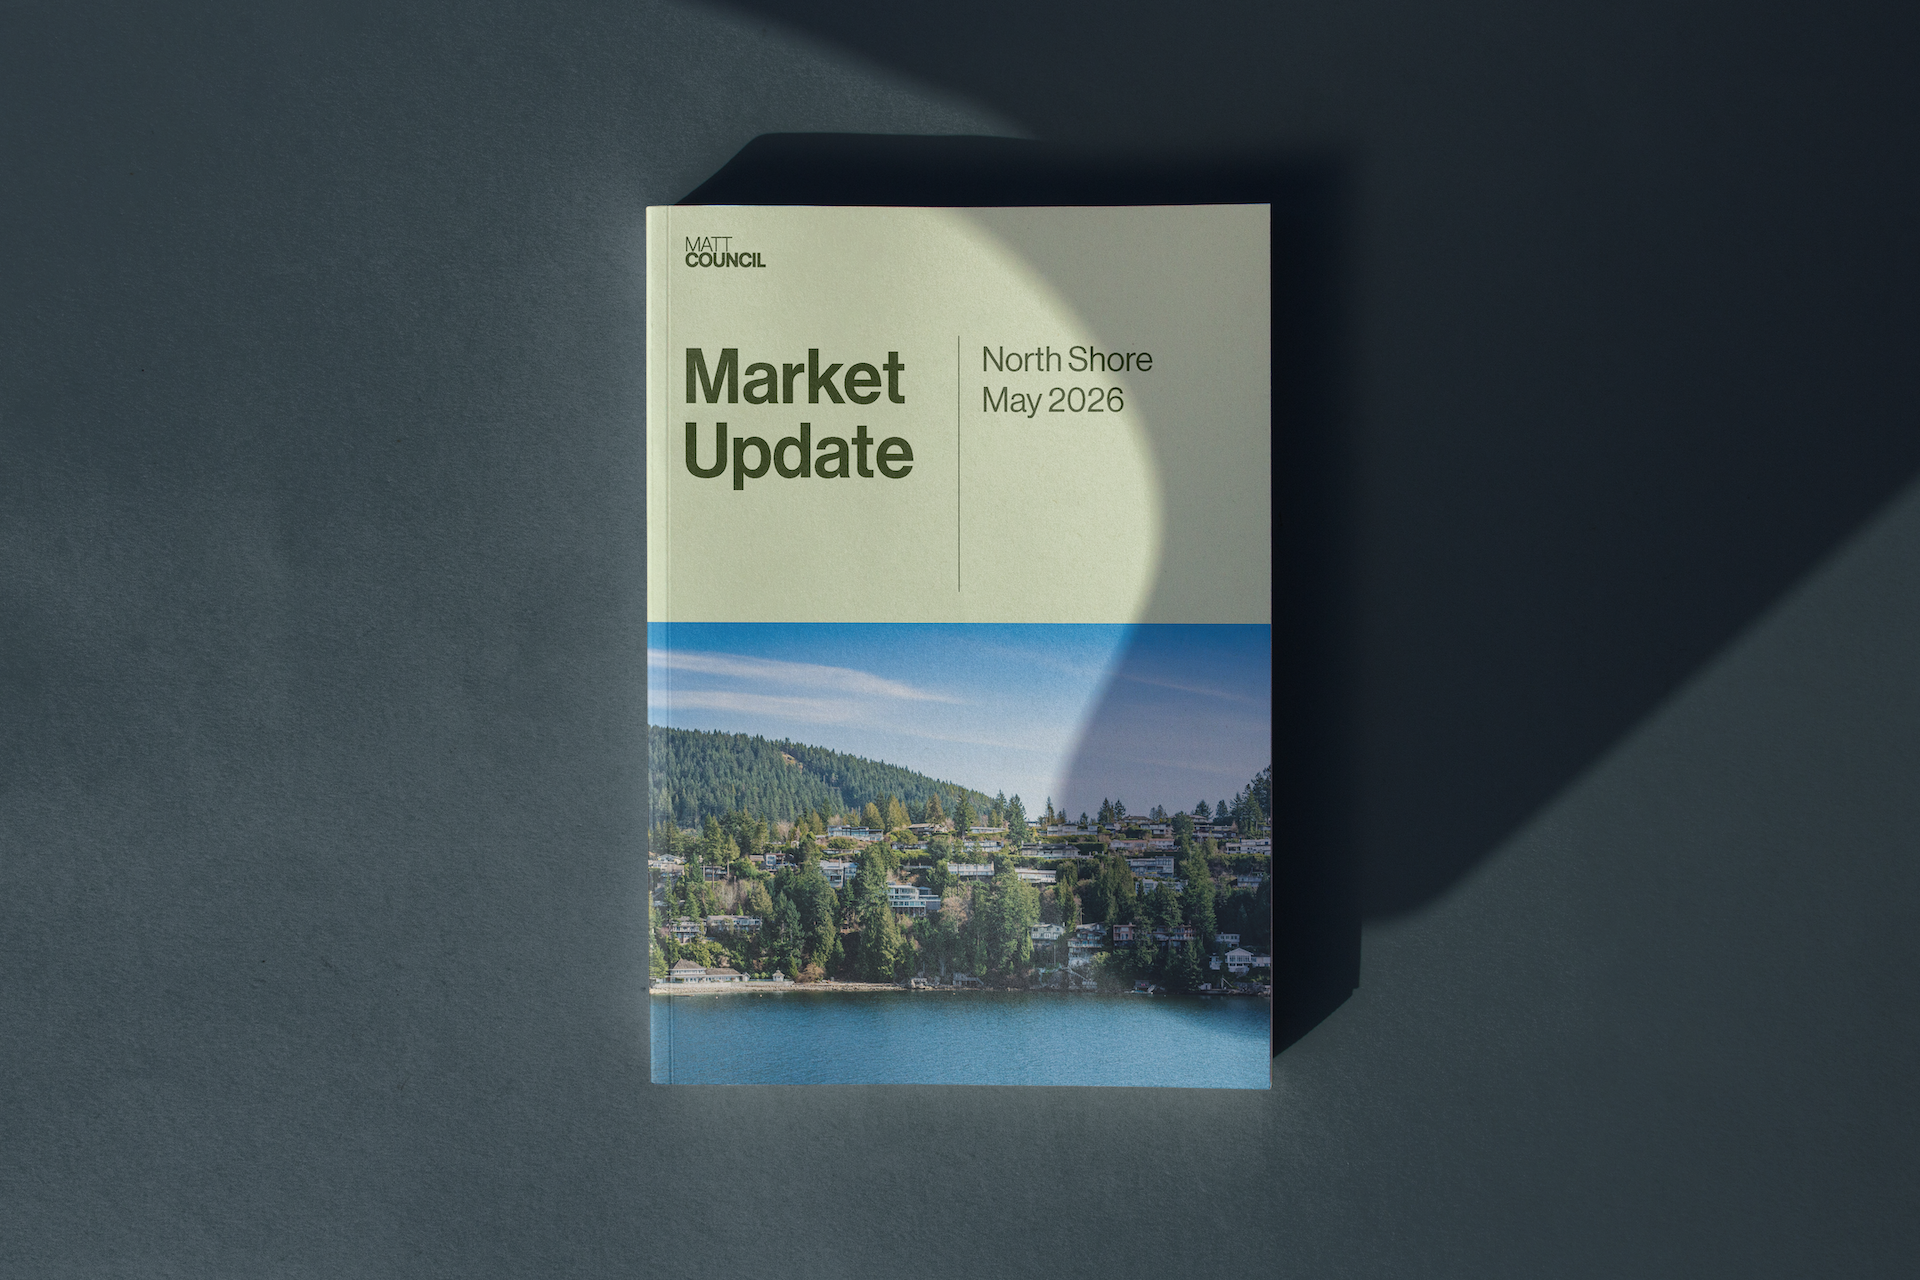
Market Update | May 2026
April shows a segmented spring market. While townhomes remain active, high inventory levels are giving buyers rare leverage across the North Shore.
Market Update | Q1 2026
March sales show seasonal momentum, but Q1 concludes with a cautious, selective tone across the North Shore.
Market Update | March 2026
Explore February 2026 real estate stats for North and West Vancouver. See why the market is increasingly selective and which buyer segments remain active.
Market Update | February 2026
North Vancouver sales volume plummeted 37% year-over-year while days on market surged 73%. Here is the financial breakdown of the market's slow start to 2026.

Market Update | 2025 Year End
2025 saw buyers prioritize value over urgency as inventory rose and prices moderated across the North Shore. Here is the full financial breakdown of the year’s adjustments and the outlook for 2026.
Market Update | December 2025
North Van cools while West Van sees a sales uptick, yet prices soften across the board. Here is the financial breakdown for the November 2025 market.
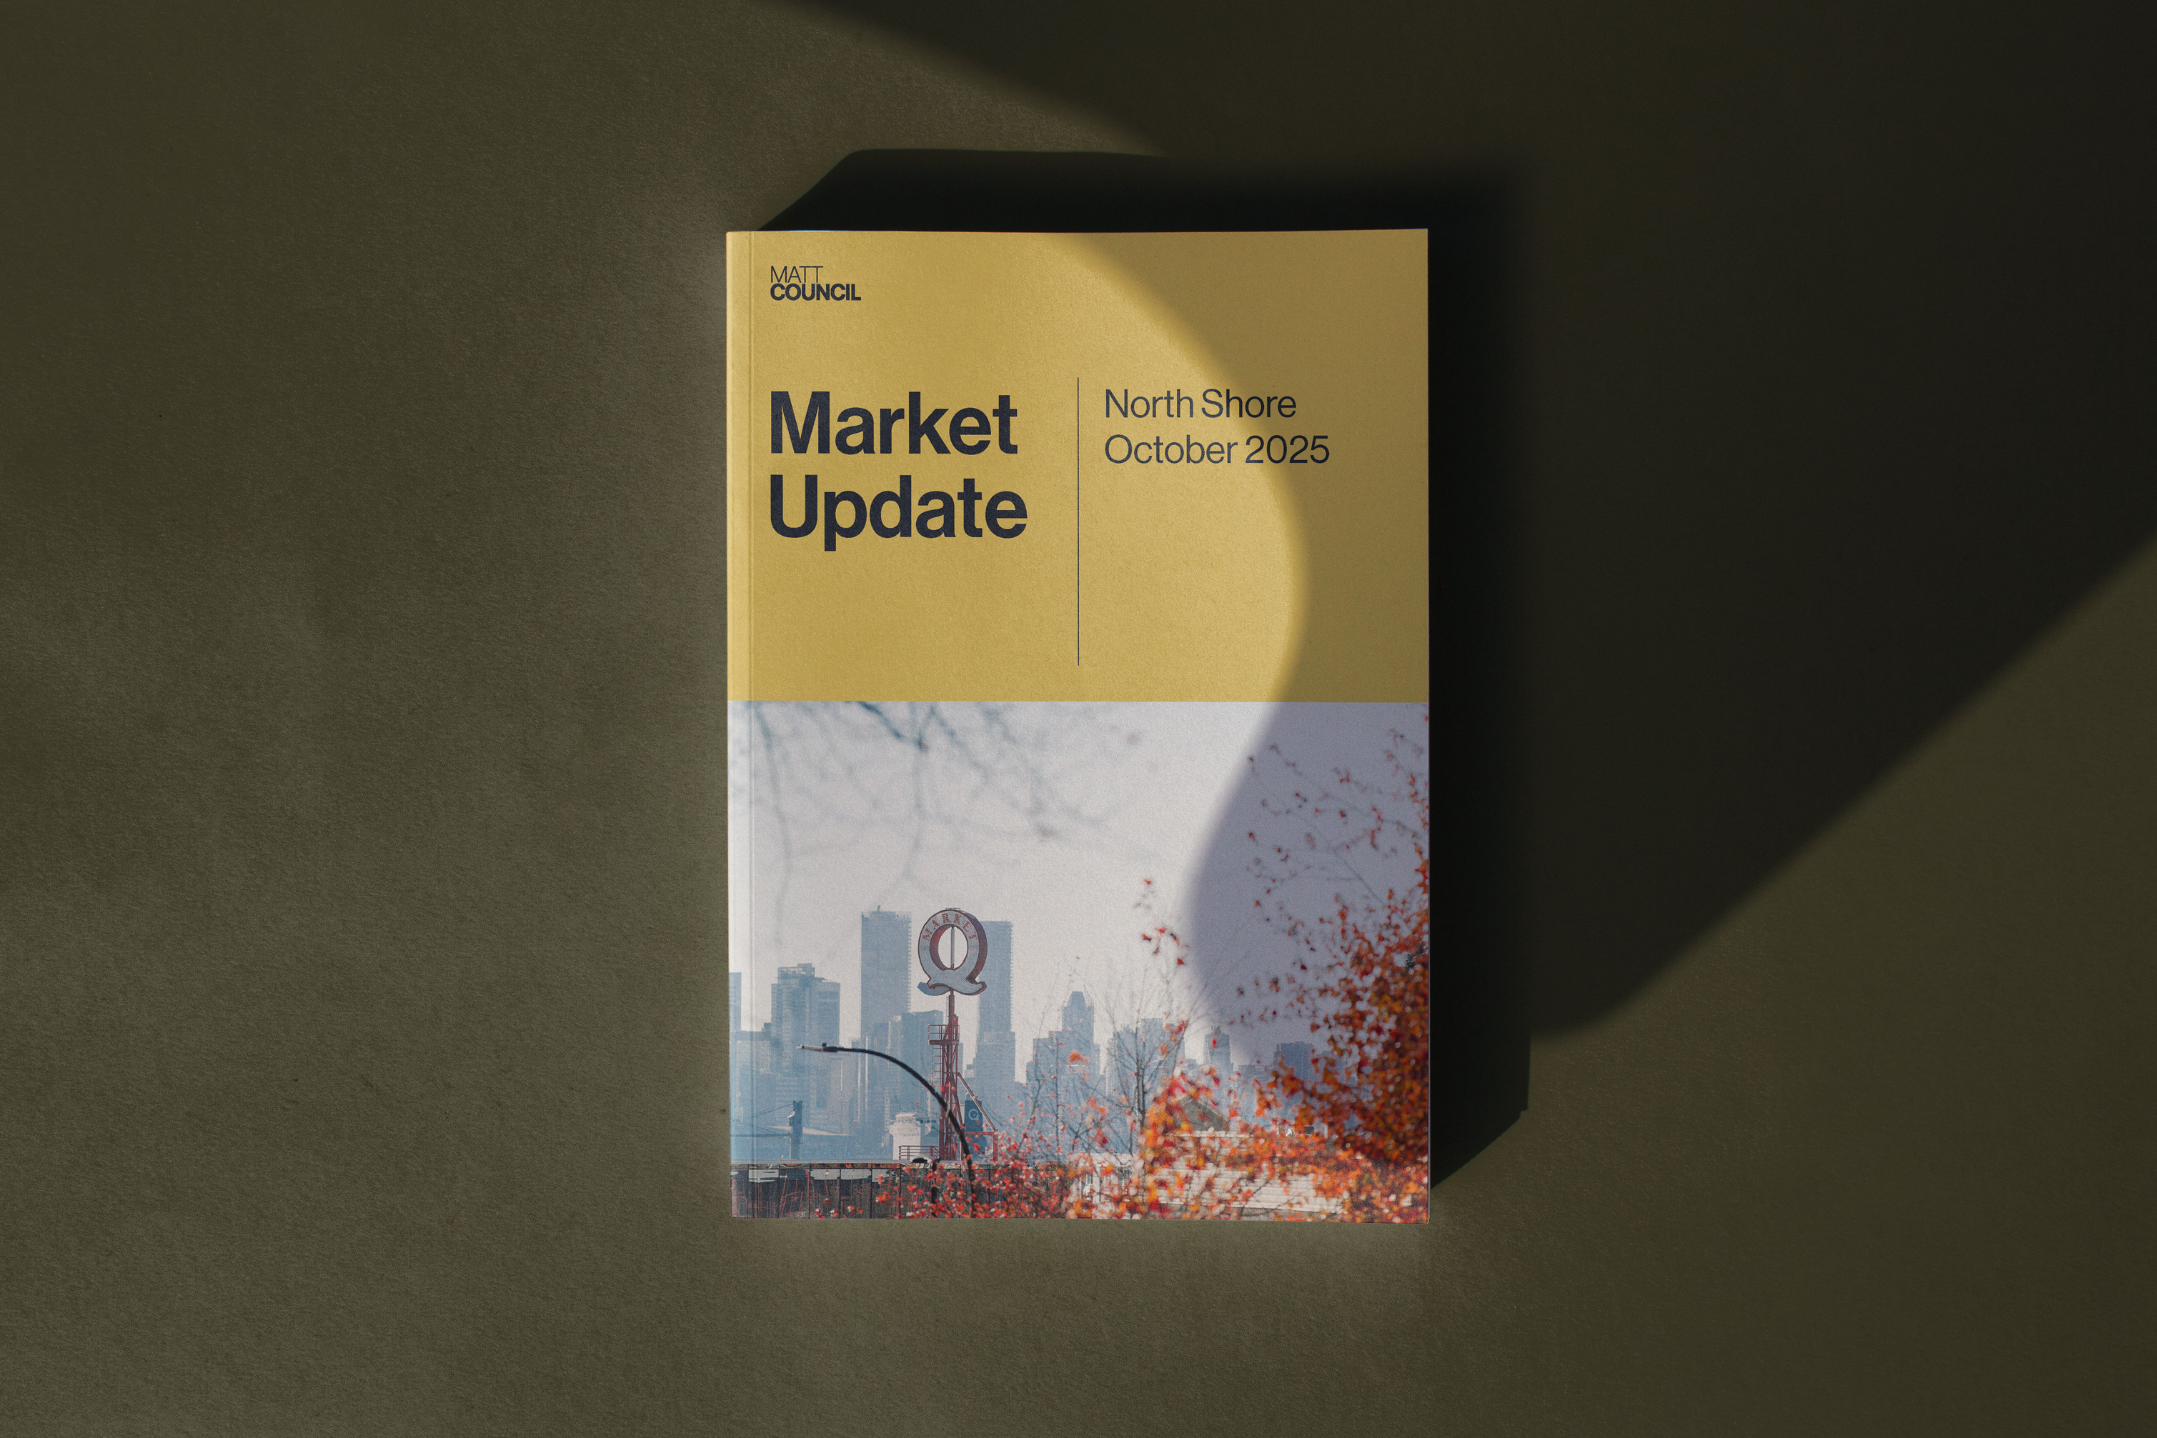
Market Update | November 2025
North Vancouver inventory is sitting 35% above the 10-year average, creating a distinct advantage for patient buyers. Here is the financial breakdown for October 2025.
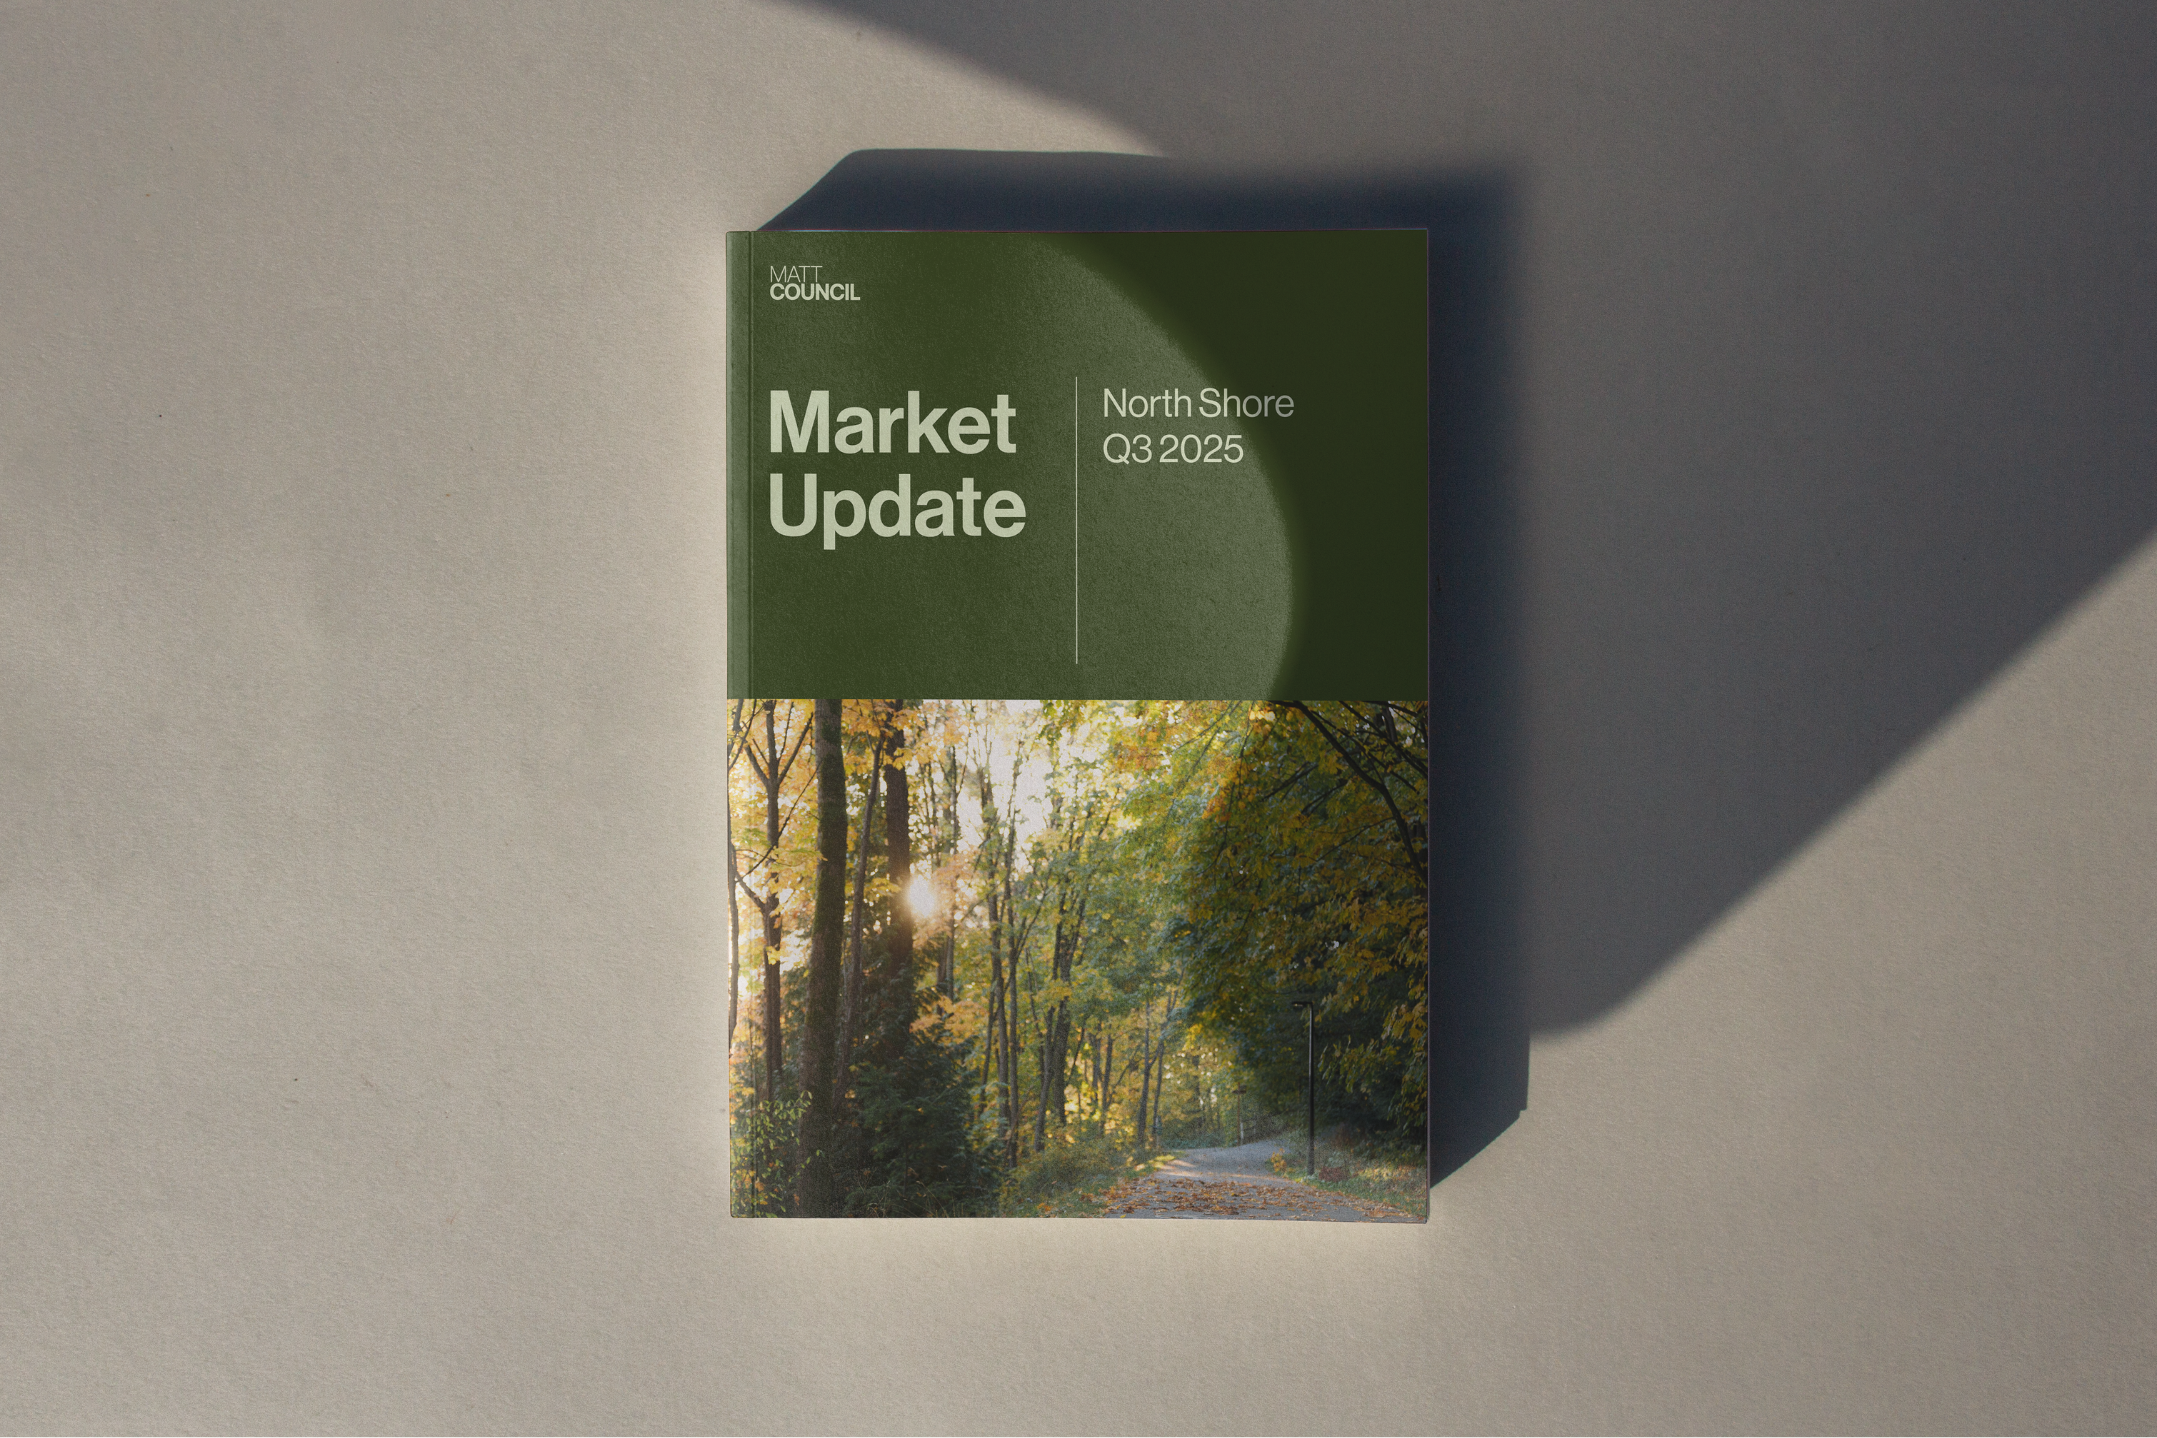
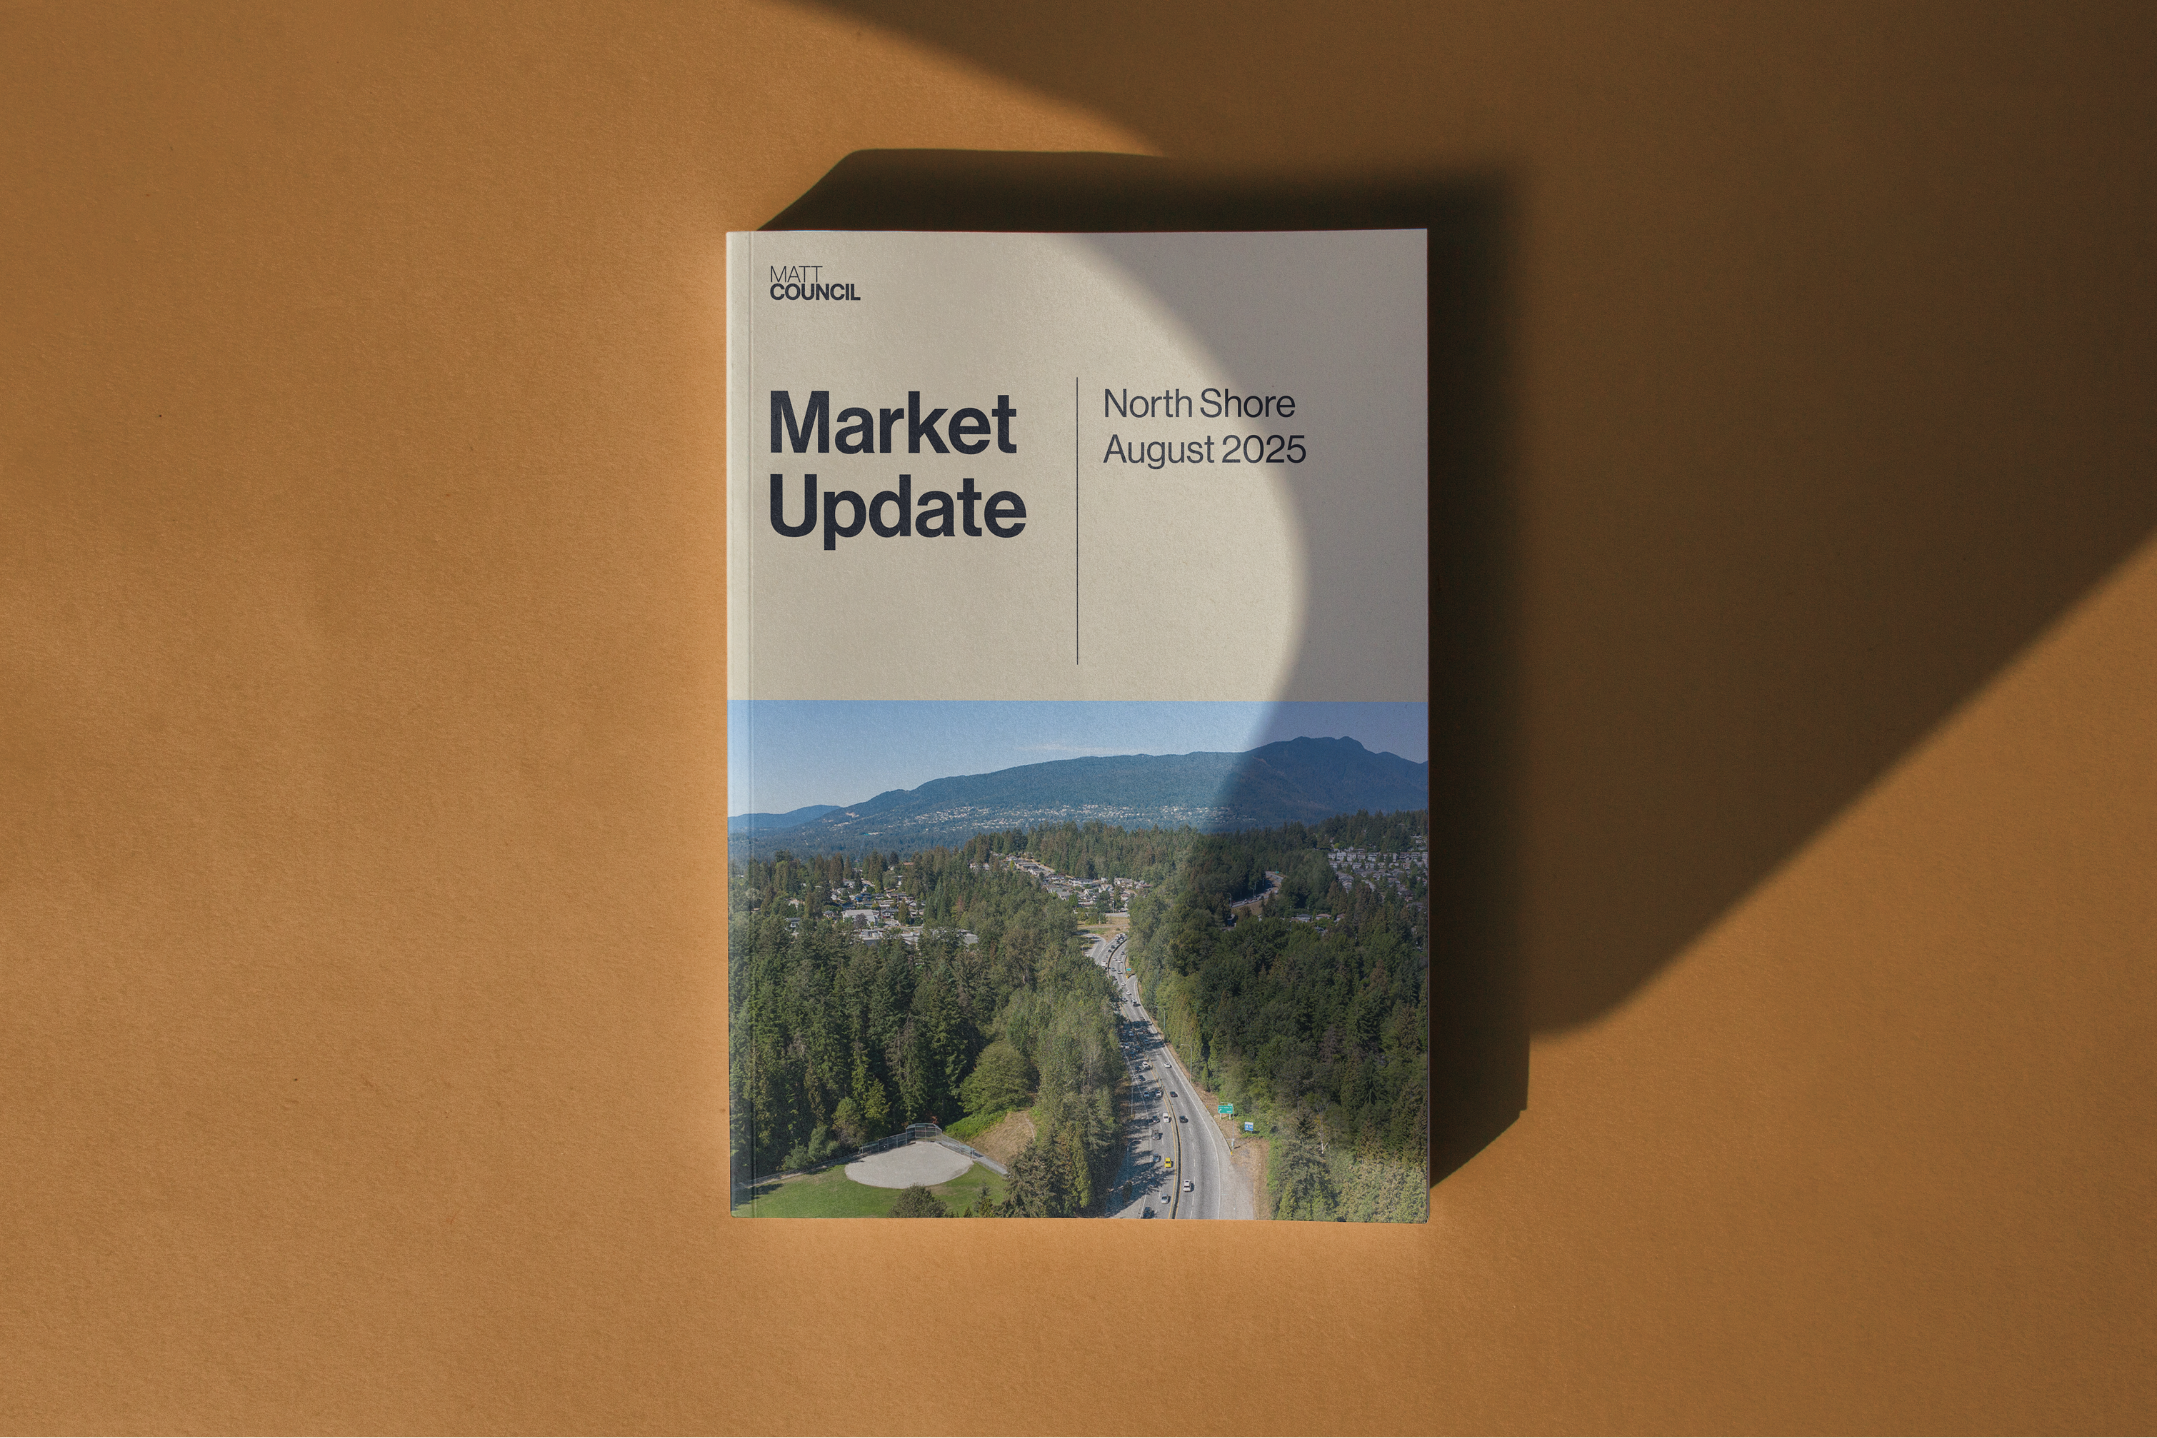
Market Update | September 2025
North Vancouver’s absorption rate dropped to its lowest point since April 2020, signaling a distinct liquidity crunch. Here is the financial breakdown for August 2025.
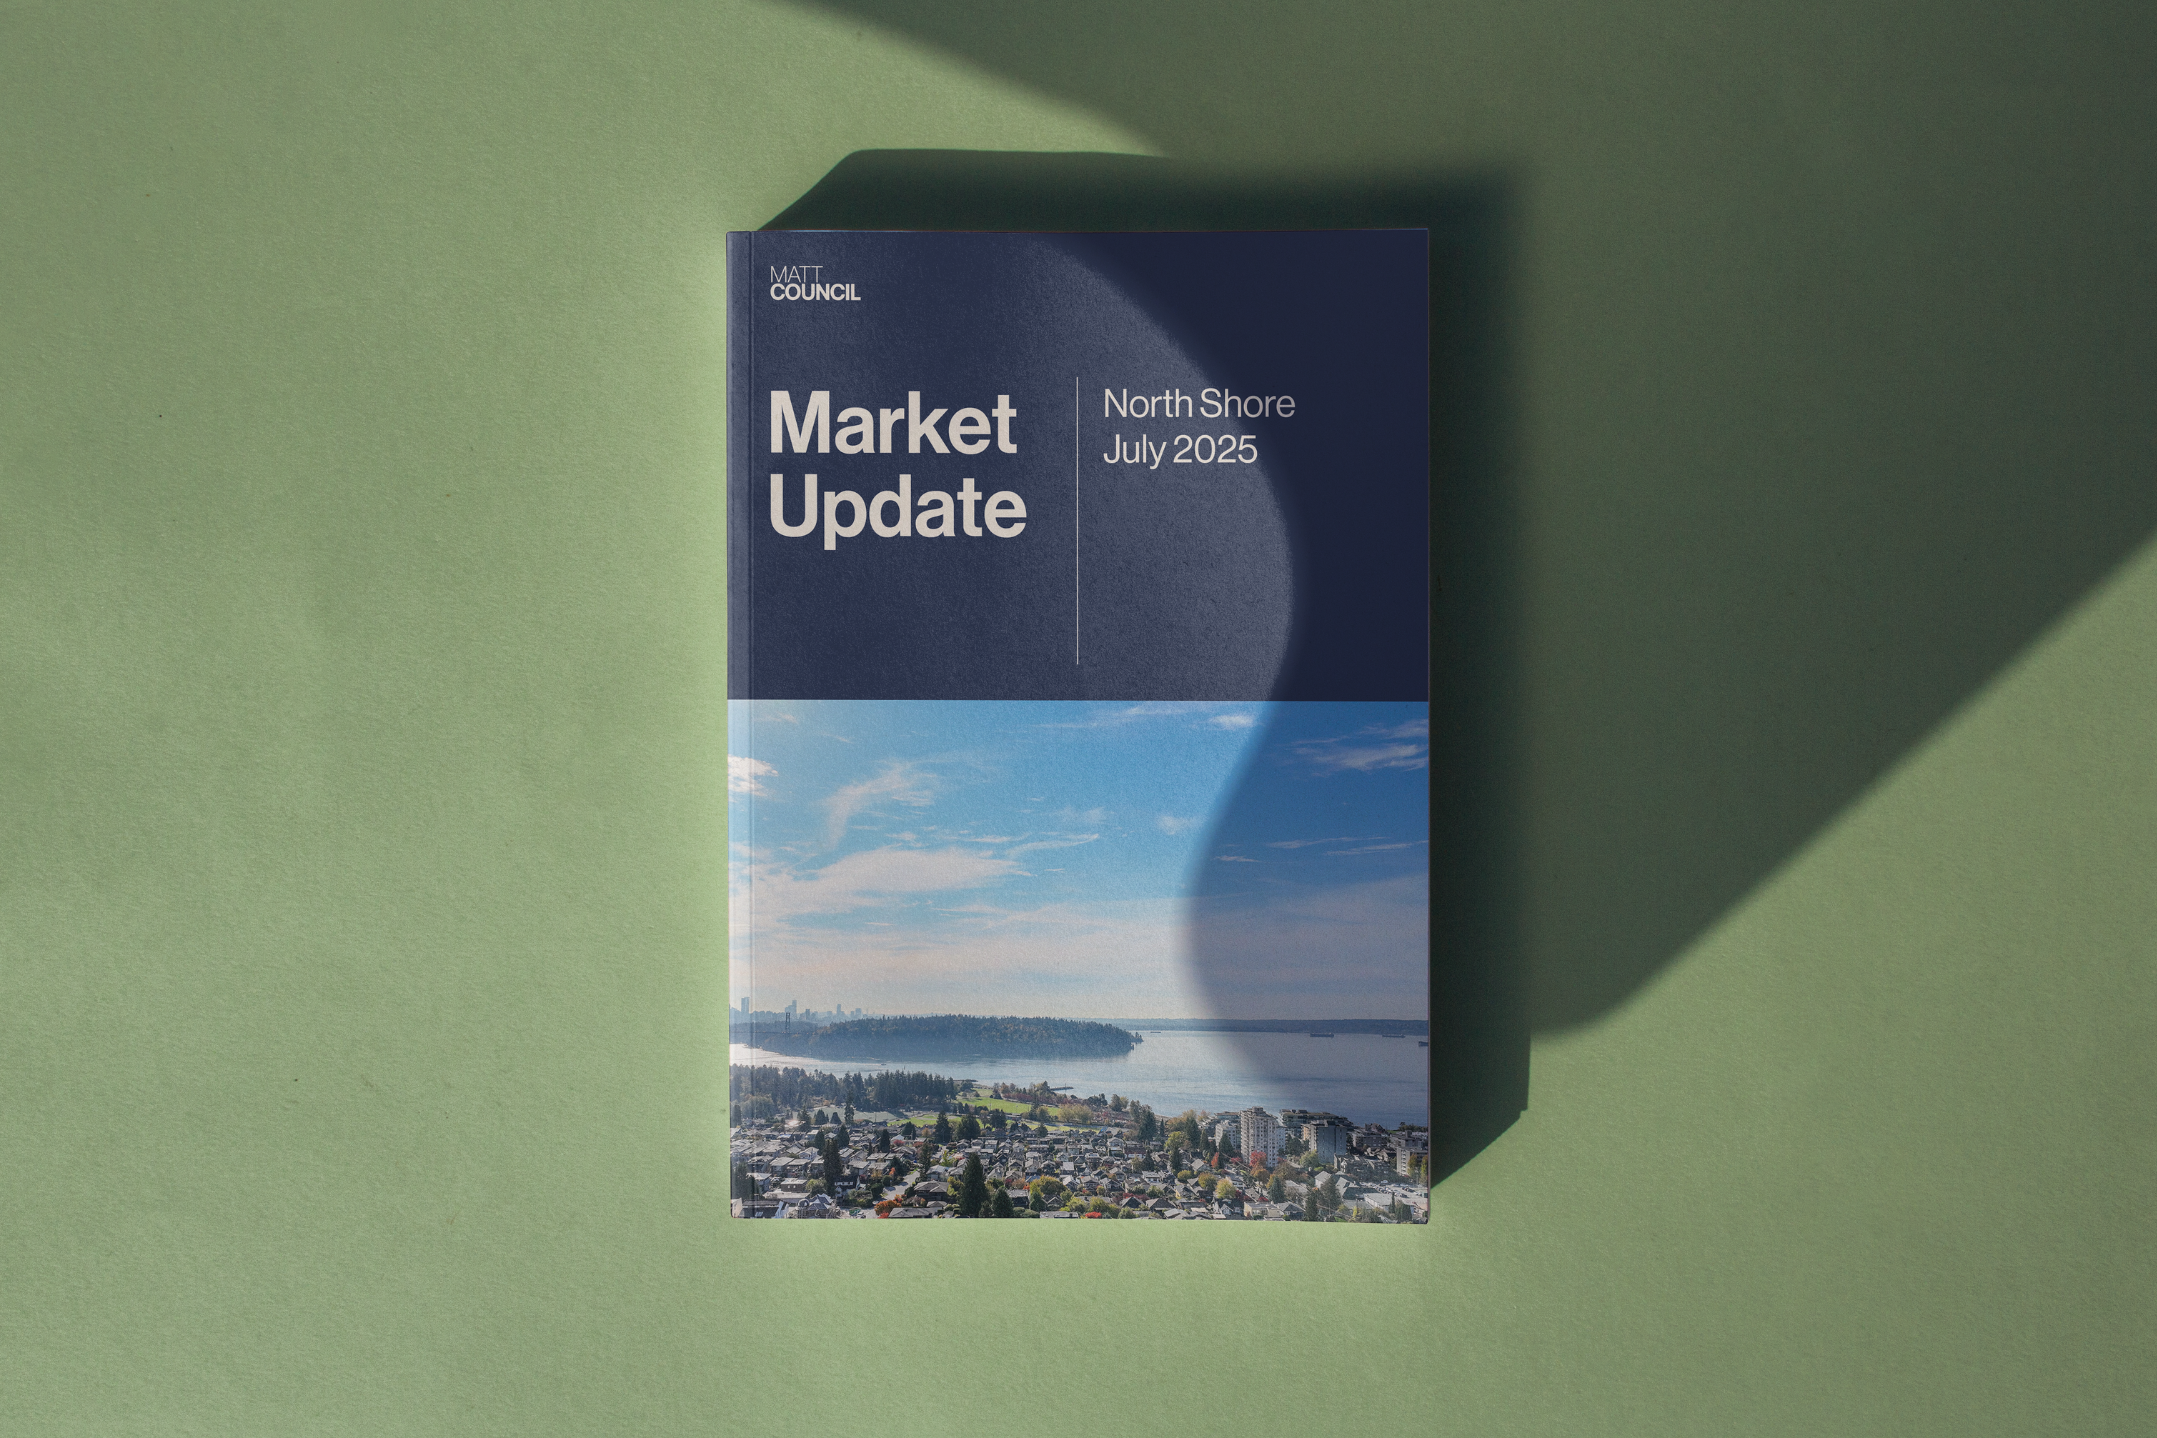
Market Update | August 2025
Unconditional offers have all but vanished as North Shore buyers manage risk. With West Van detached prices down 13%, the market is repricing aggressively.
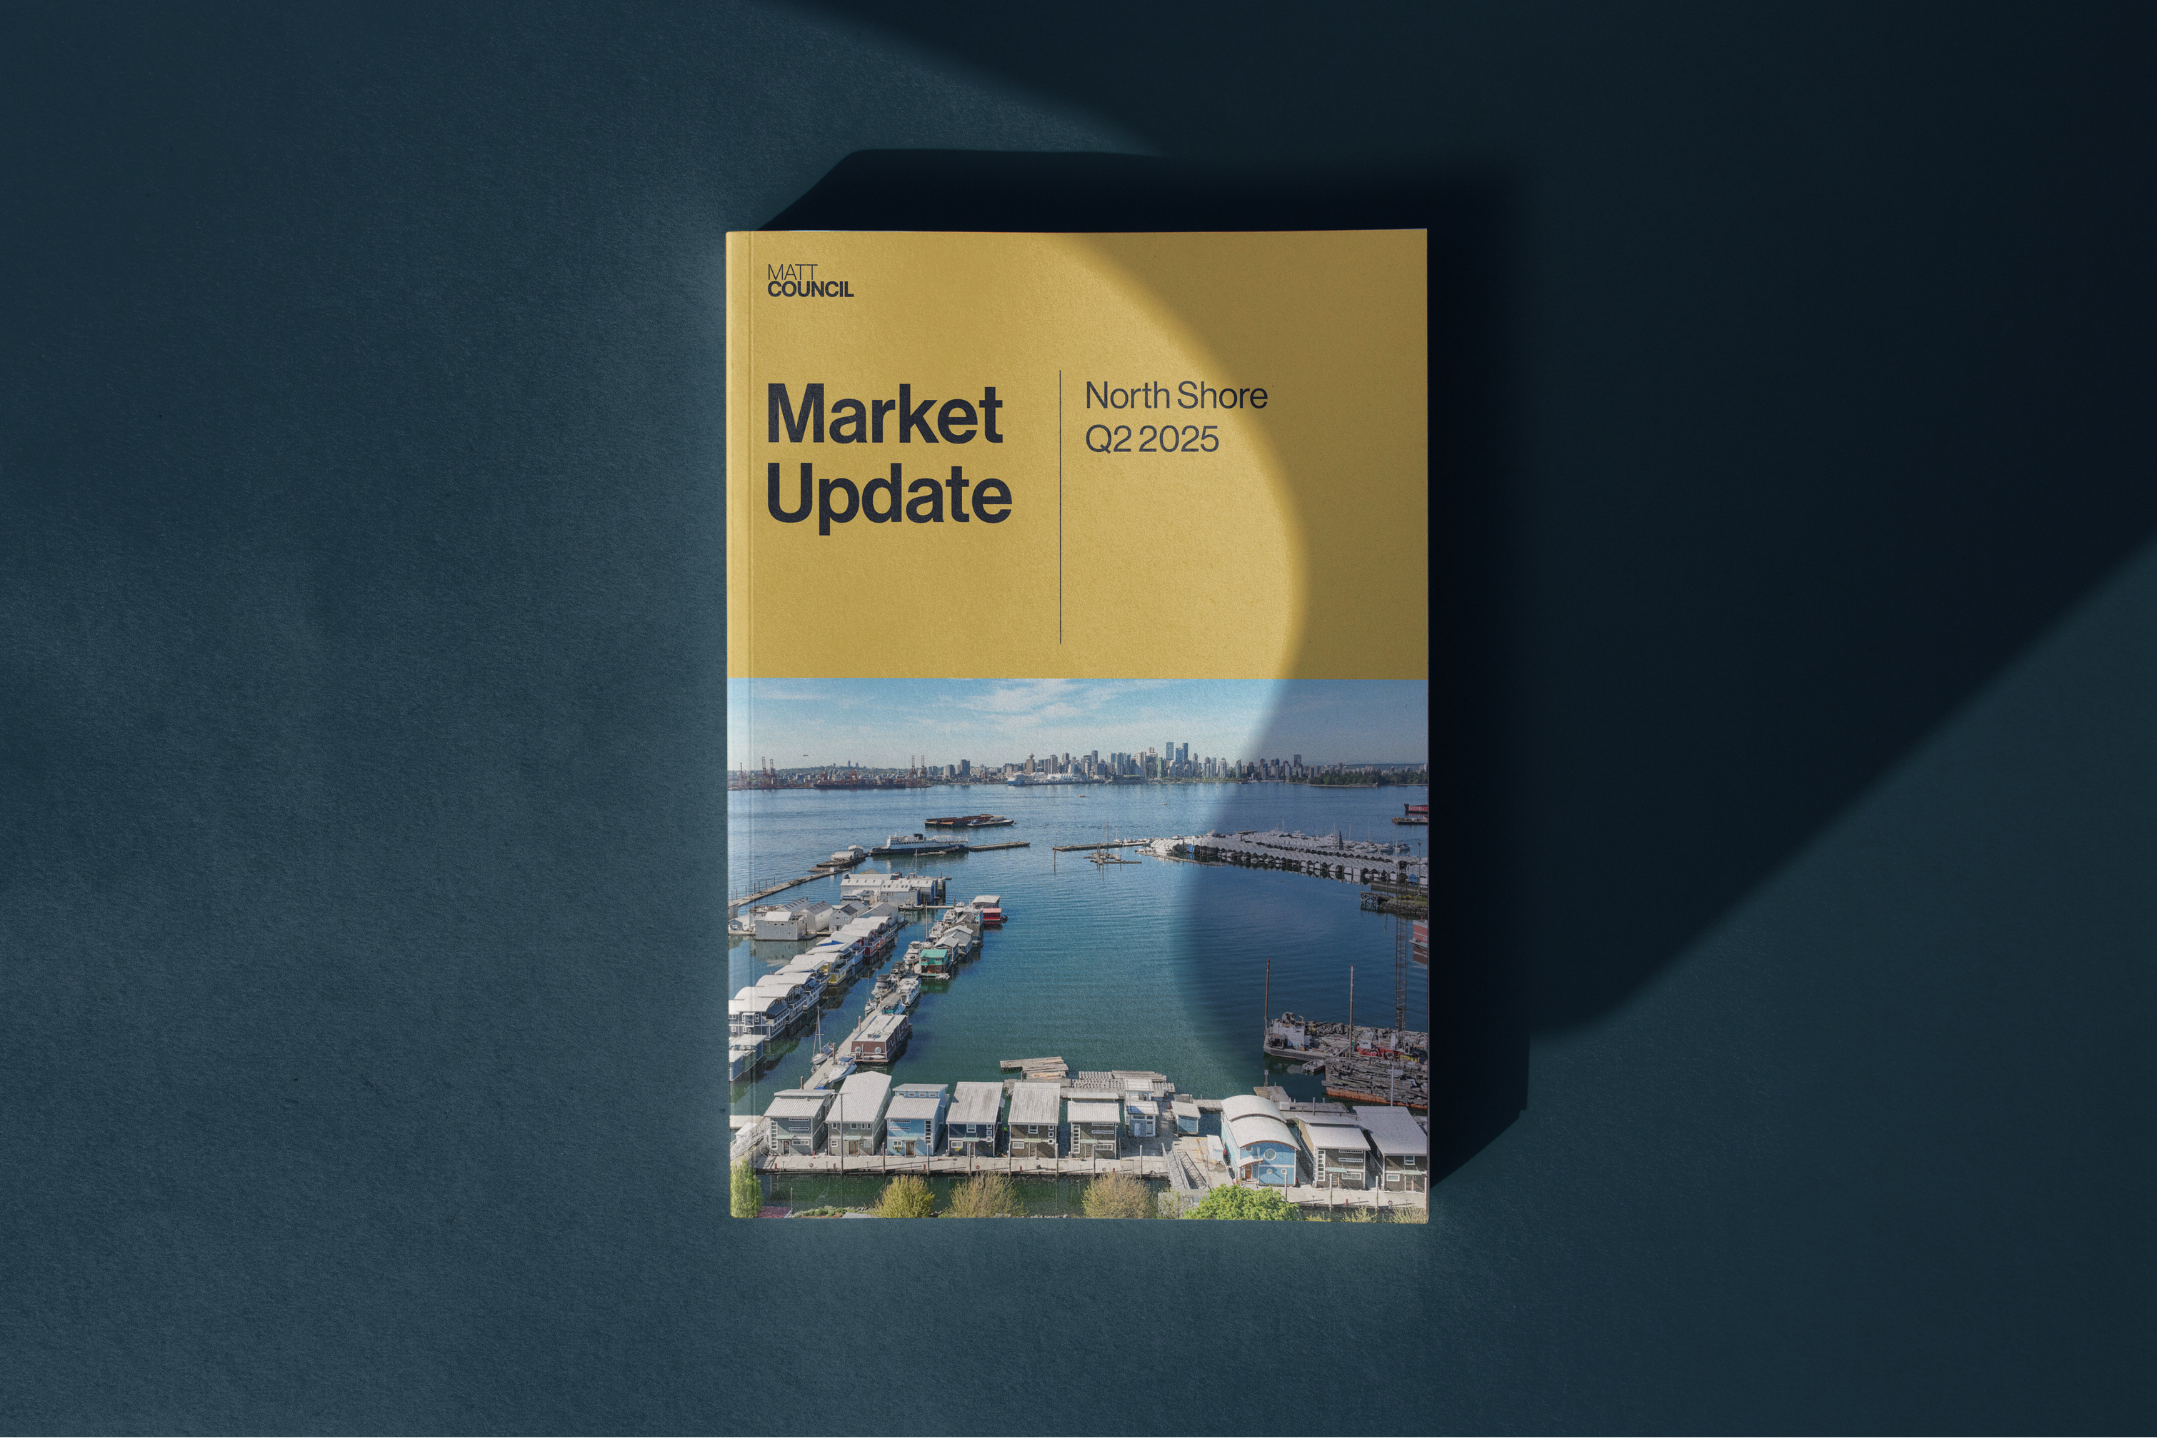
Market Update | Q2 2025
North Vancouver inventory is 45% above the 10-year average as global headwinds dampen Q2 buyer sentiment. Here is the financial breakdown for June 2025.
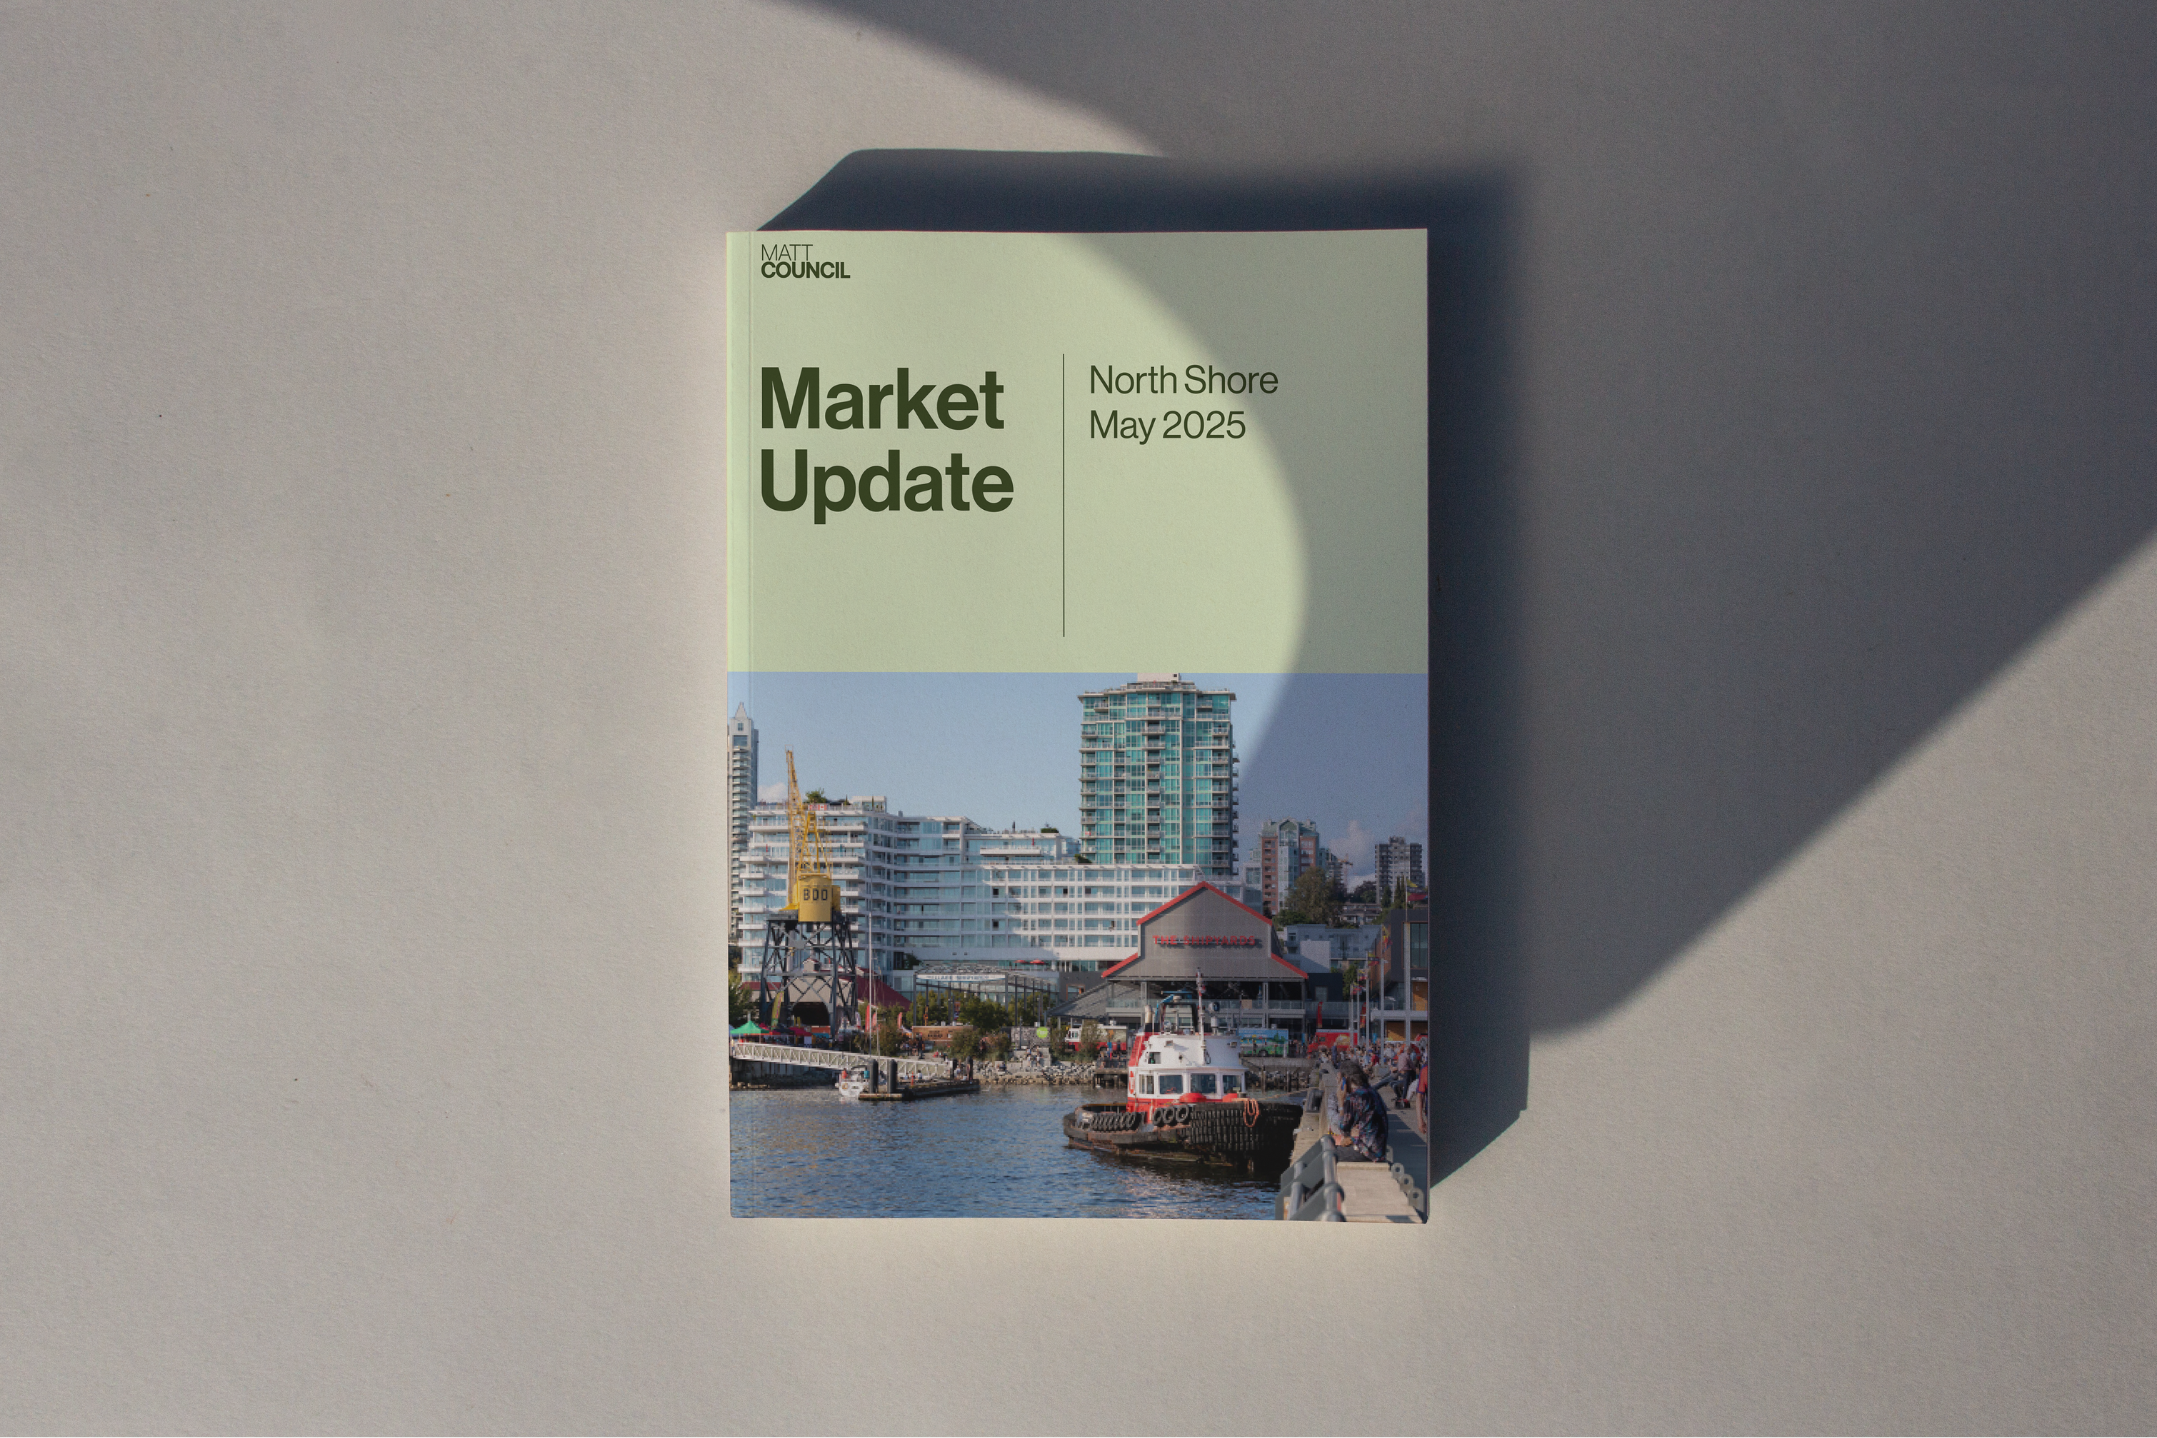
Market Update | June 2025
North Vancouver inventory is 45% above the 10-year average as global headwinds dampen Q2 buyer sentiment. Here is the financial breakdown for June 2025.