
Market Update | August 2026
A review of market trends and statistics for July 2026.
Fewer Sellers, Fewer Buyers: July's Standoff on the North Shore
The North Shore market slowed back down in July after June's brief pickup in activity. Both North and West Vancouver recorded fewer sales than the same month last year, and inventory kept tightening as fewer sellers came to market. With supply and demand both pulling back at the same time, the result looks less like a shift in either direction and more like a standoff, one that's likely to carry into late summer.
At a Glance
- Sales slowed in both markets: North Vancouver sales fell 20.0% year-over-year to 152, and West Vancouver sales dropped 8.3% to 55. Prices softened alongside the pullback, with North Van detached homes down 5.0% and West Van condos down 13.5%.
- Inventory tightened everywhere: New listings dropped 17.6% in North Vancouver and 22.0% in West Vancouver. Total listings followed, down 11.5% to 985 in North Van and down 12.3% to 671 in West Van.
- A real gap in market tightness: North Vancouver's overall sales-to-active ratio sat at 15.4%, balanced territory, while West Vancouver came in at 8.2%, solidly buyer-favouring. That's the clearest signal of how differently these two markets are behaving right now.
- The sub-$750K sweet spot: In North Van, homes priced under $750,000 posted a 20.4% sales-to-active ratio, the strongest of any price band, while listings above $3M managed just 11.8%.
North Van Cools, West Van Holds Steadier
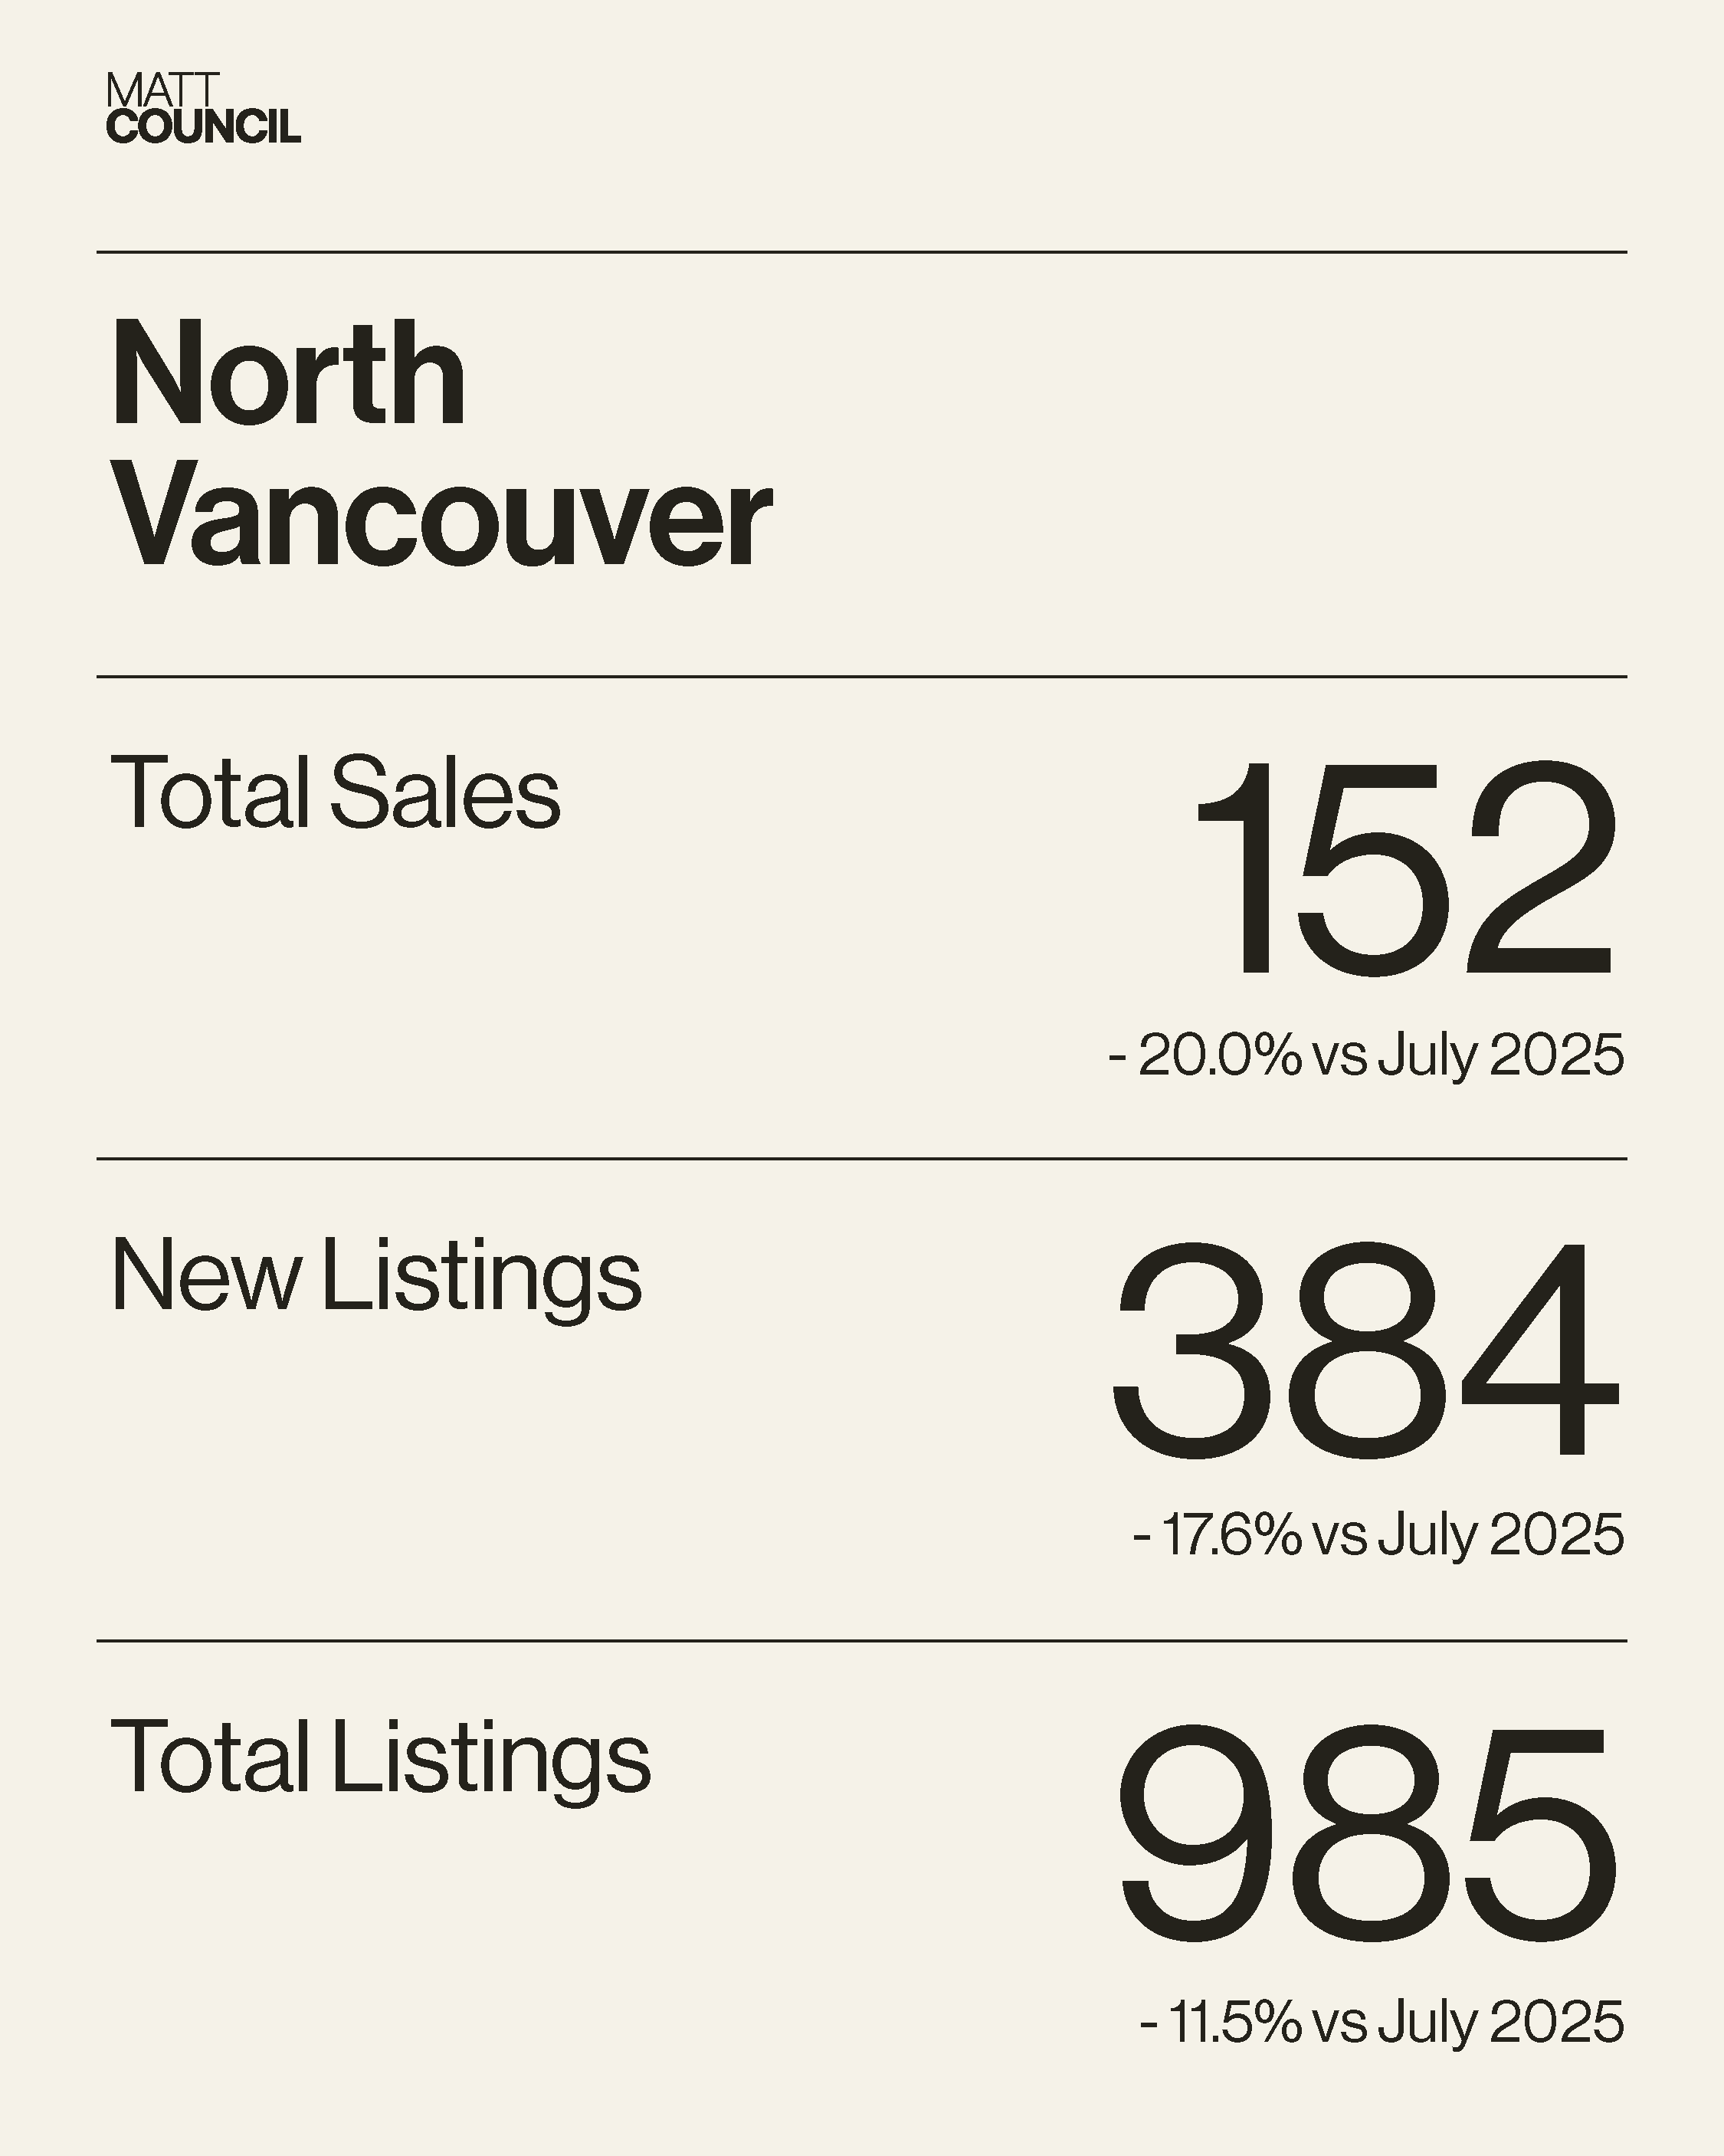
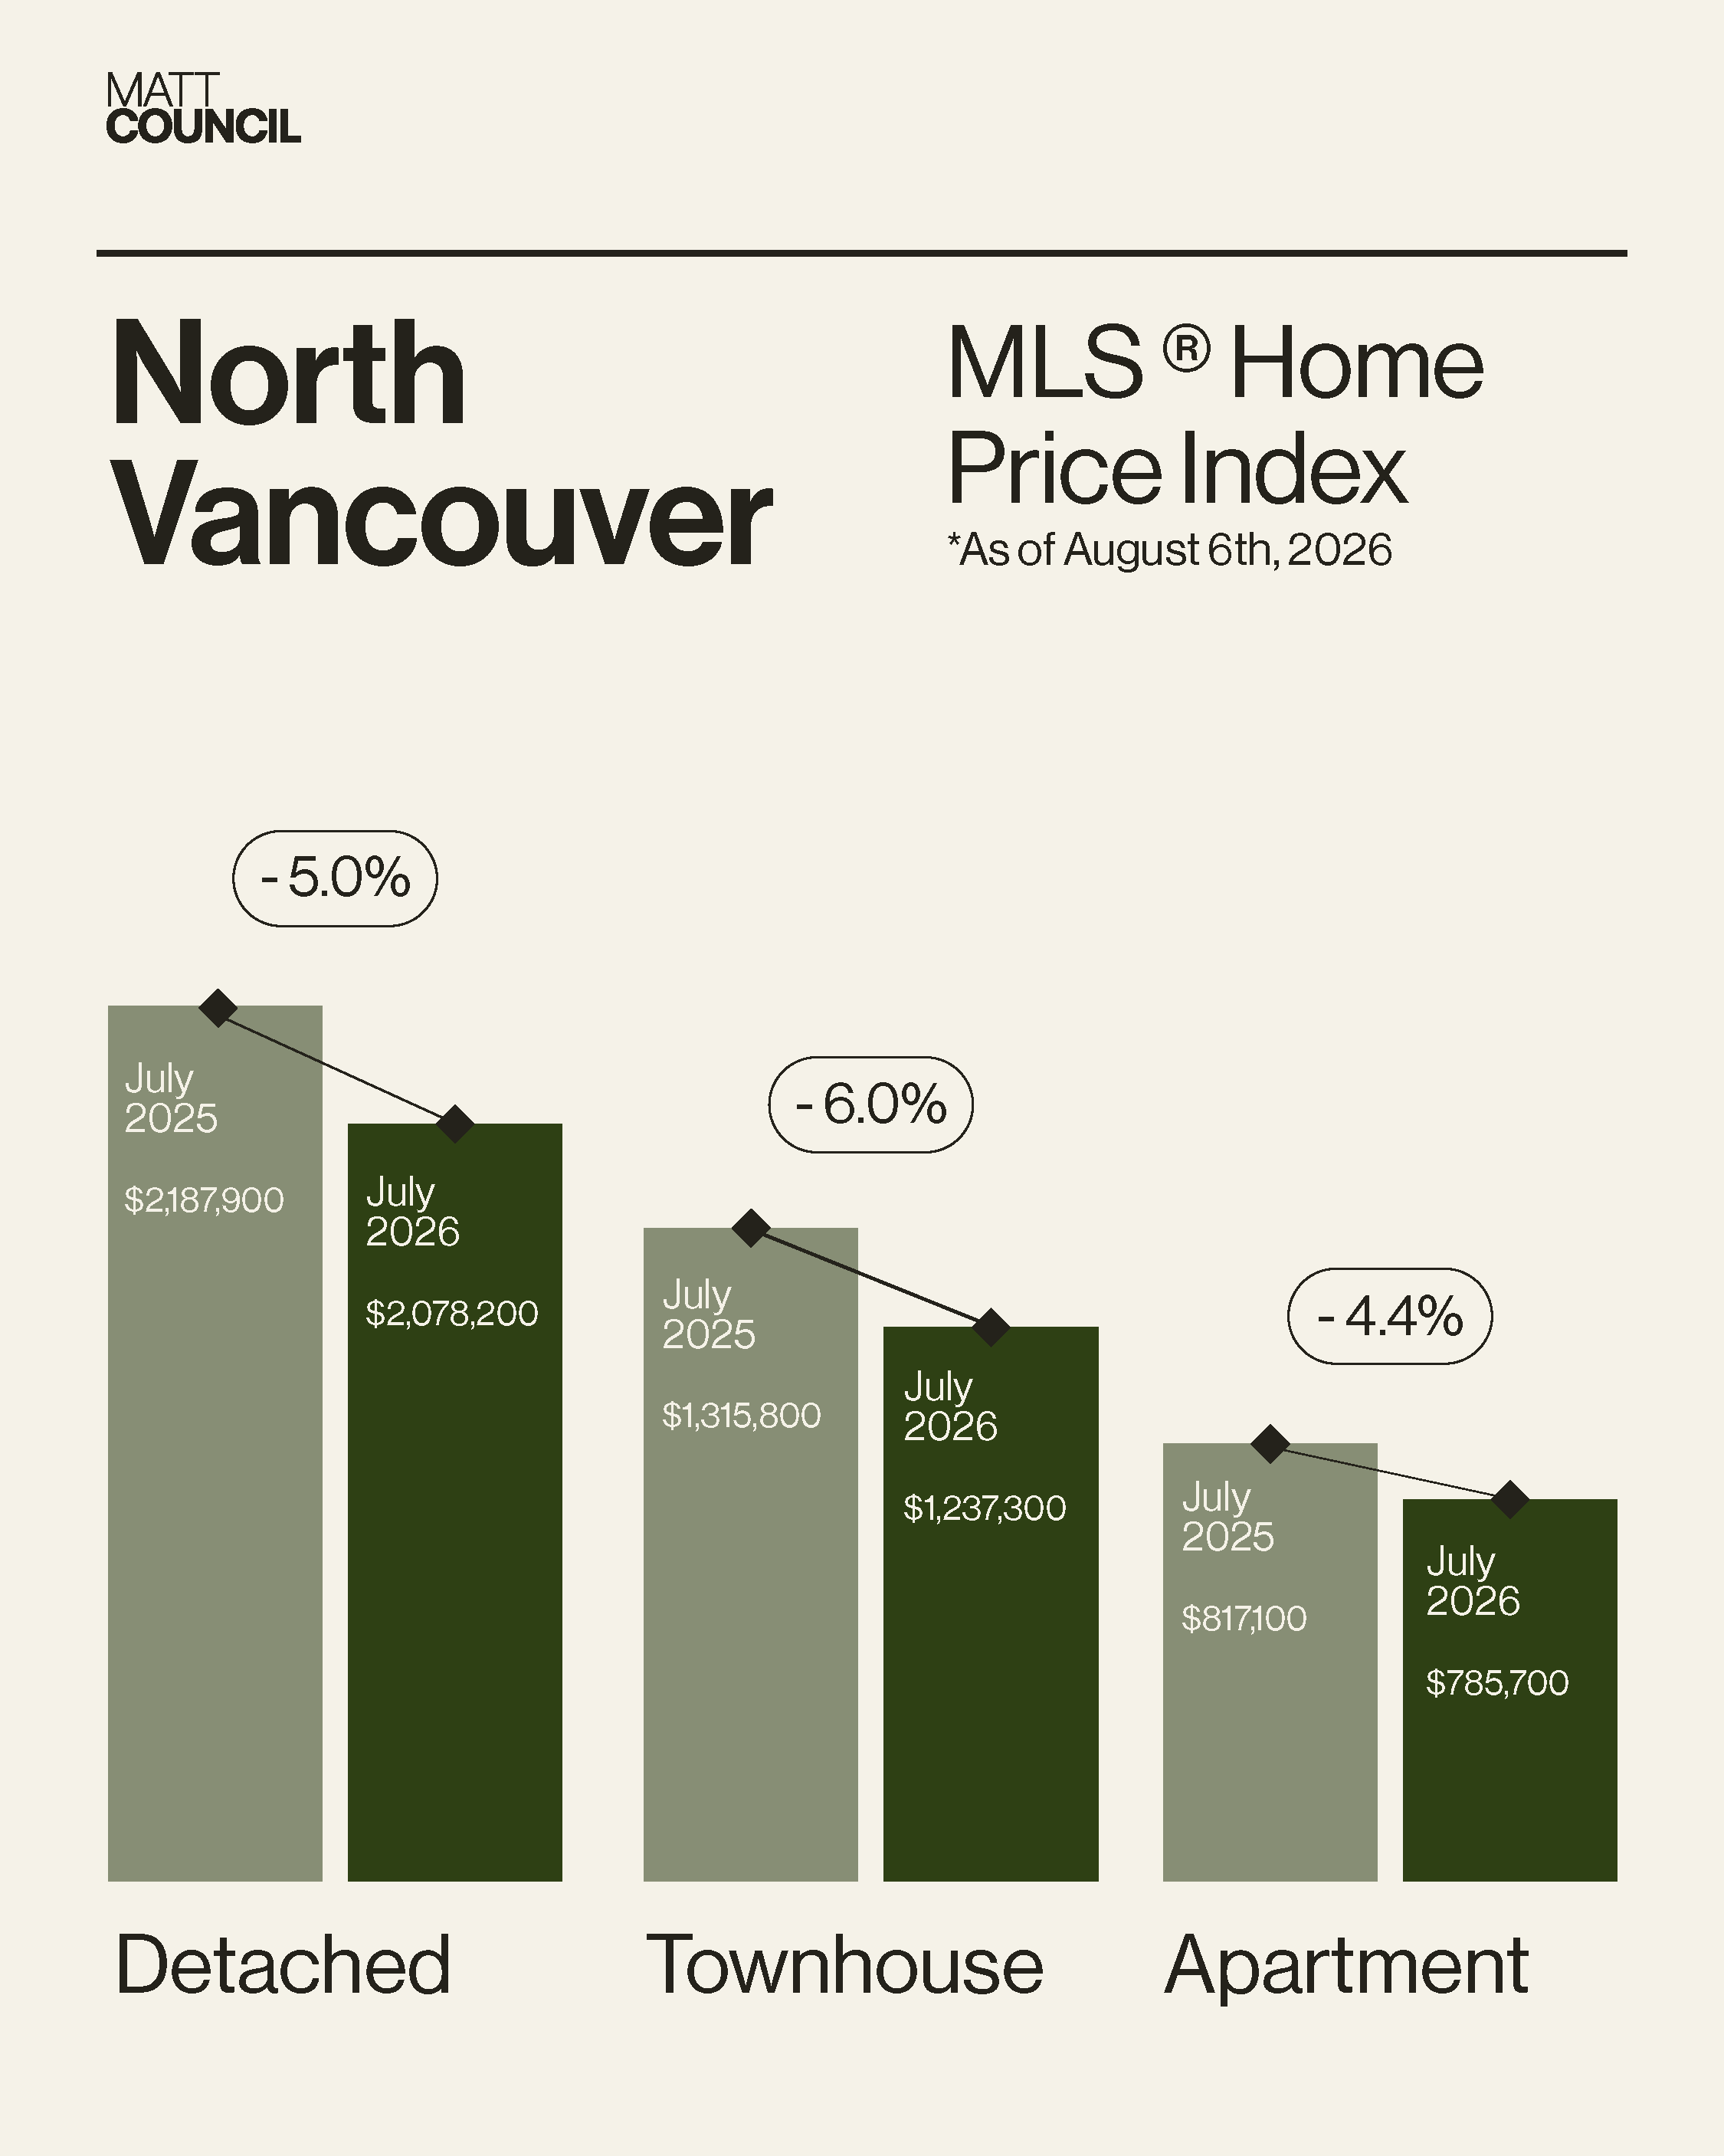
In North Vancouver, sales fell 20.0% year-over-year to 152, landing 26.1% below the ten-year average for the month. New listings dropped 17.6% to 384, and total inventory eased 11.5% to 985, still 28.5% above the ten-year average, so buyers have plenty of choice. That combination pushed the sales-to-active ratio down to 15.4%, balanced territory but a step softer than earlier in the year. Homes are also taking longer to sell, with days on market up 33.3% to 24, and the sale-to-original-list-price ratio slipped to 96.2%. Benchmark prices softened across every property type: houses down 5.0% to $2,078,200, condos down 4.4% to $785,700, and townhomes down 6.0% to $1,237,300.
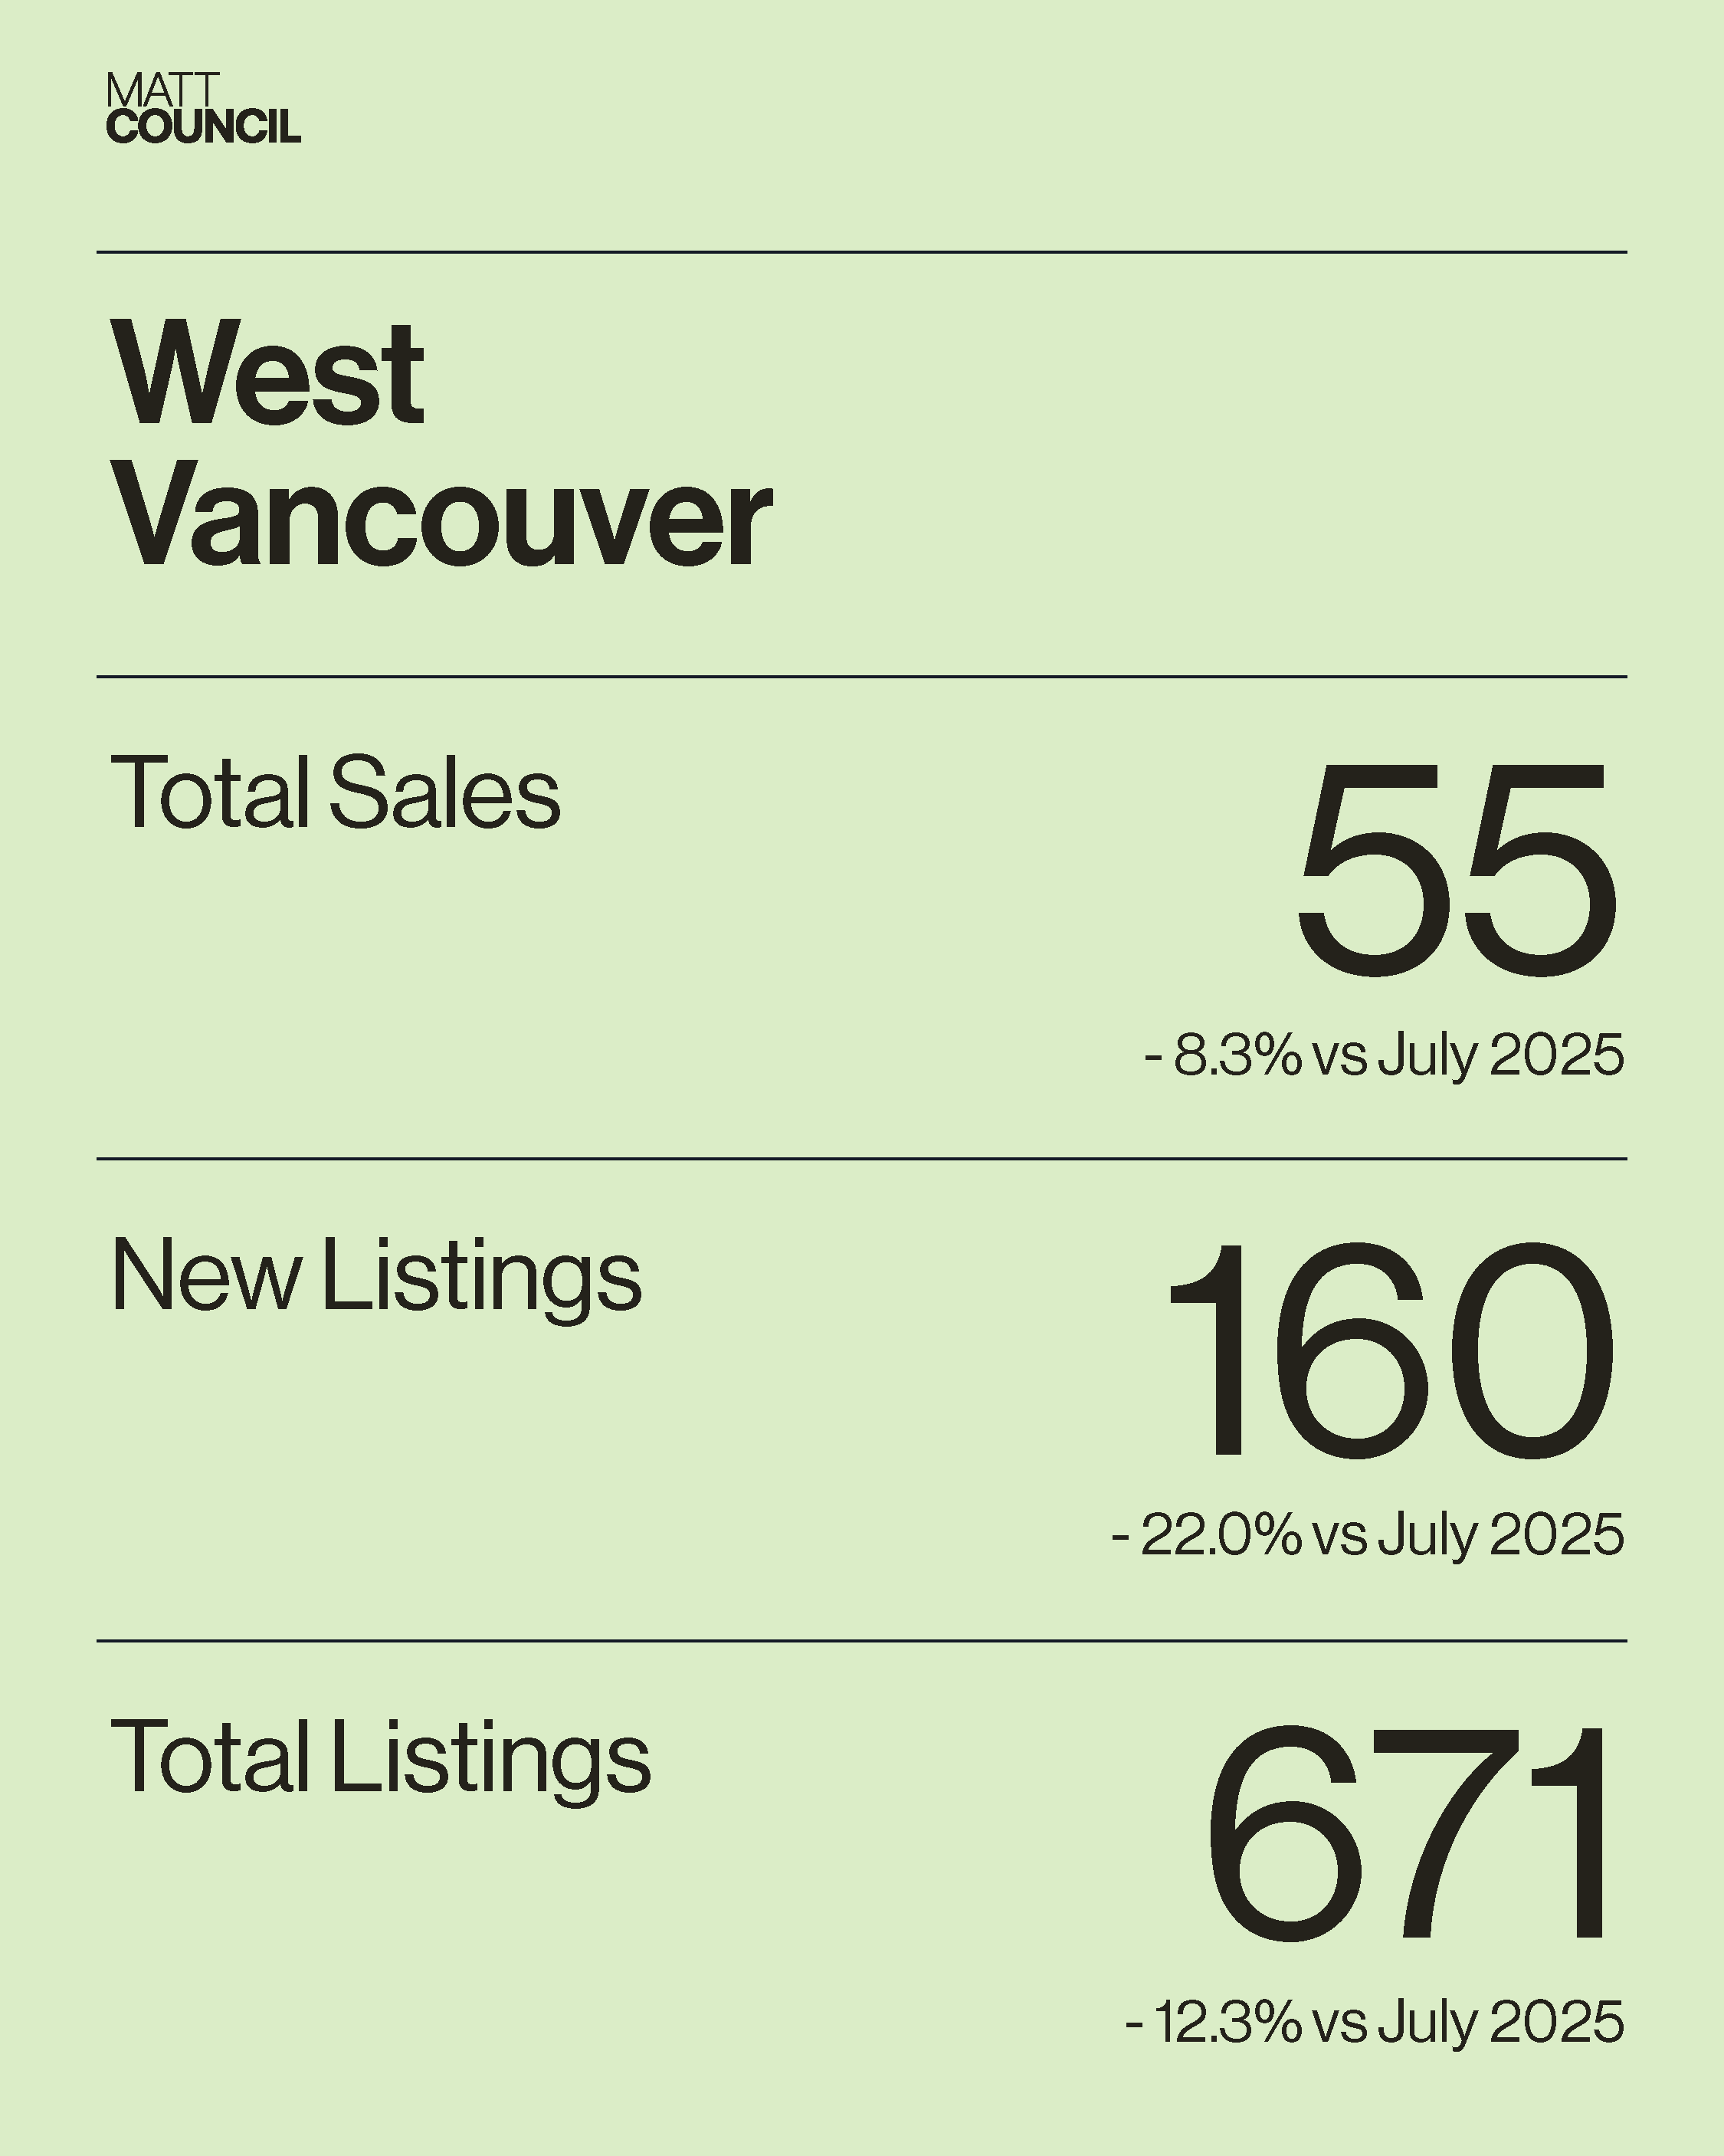
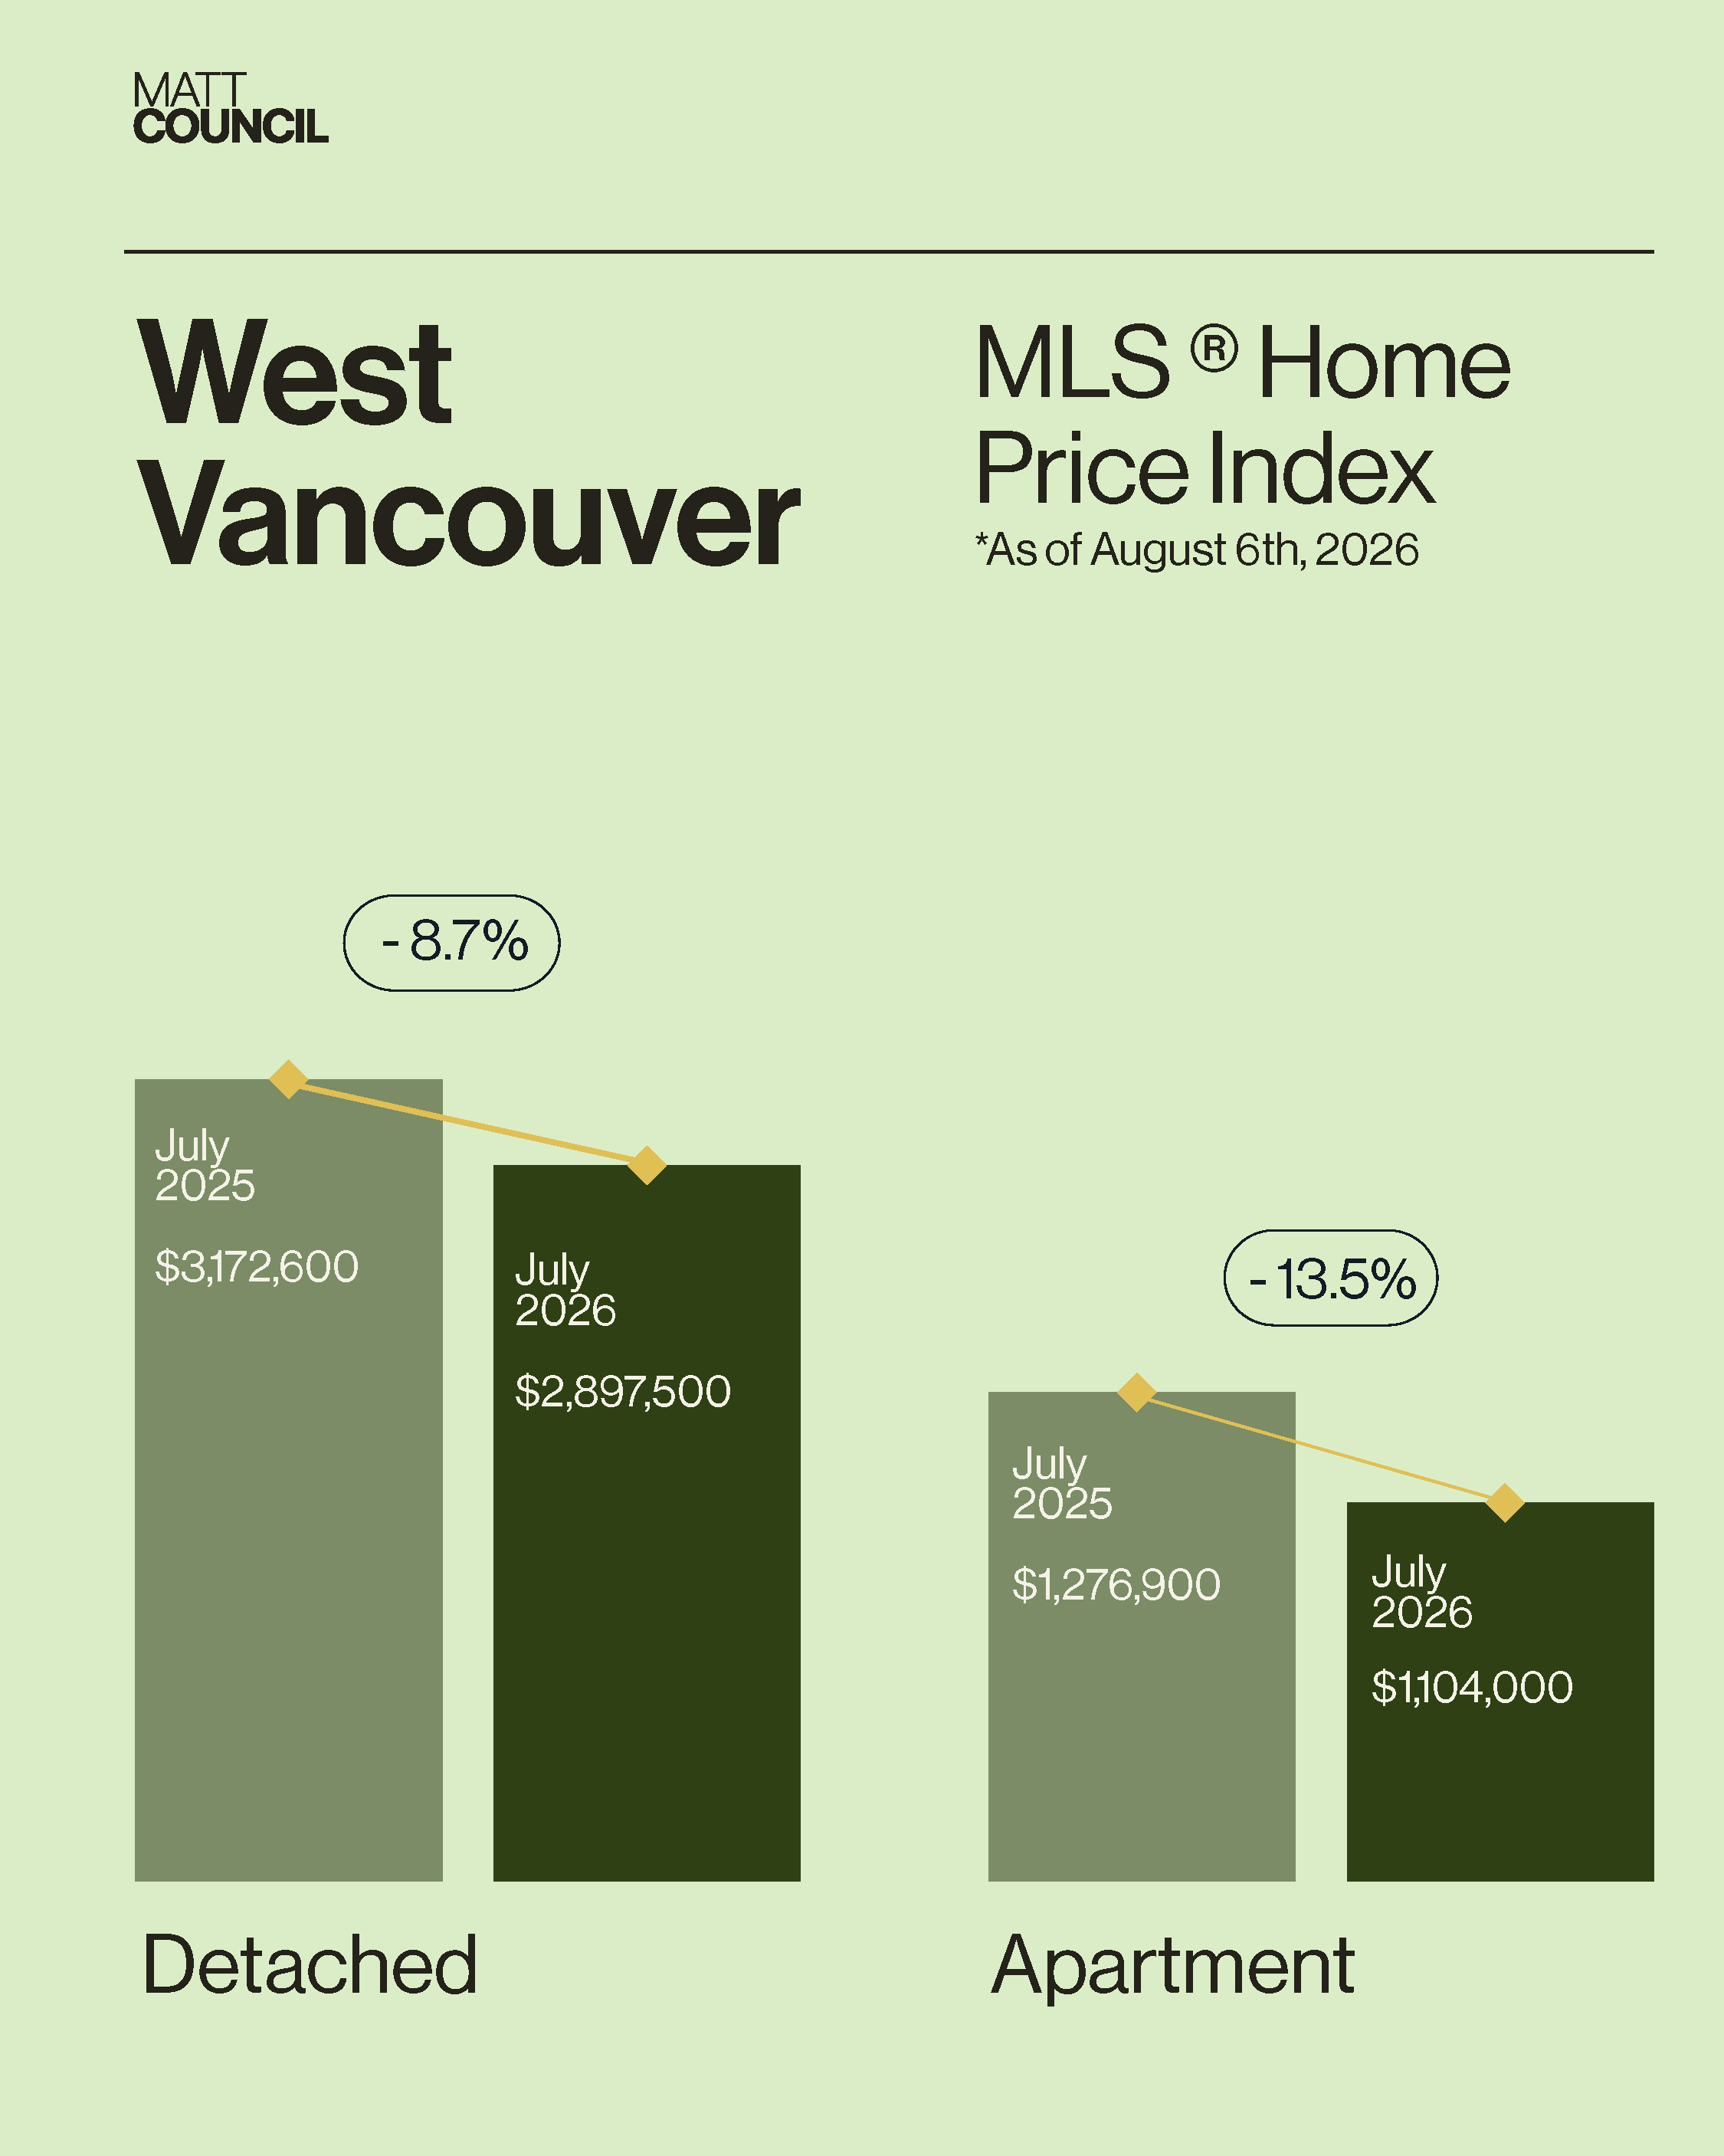
West Vancouver held up a little better on sales, down 8.3% to 55, a smaller decline than North Vancouver's. New listings fell 22.0% to 160 and total inventory dropped 12.3% to 671, a figure now sitting within 1% of its ten-year average, tighter than North Vancouver's continued surplus. The sales-to-active ratio came in at 8.2%, solidly buyer-favouring territory. Days on market actually improved, down 6.3% to 30, and the sale-to-original-list-price ratio held close to last year at 92.1%. Pricing kept adjusting, with houses down 8.7% to $2,897,500 and condos down 13.5% to $1,104,000 (townhome data wasn't reliable enough to report this month).
Why Some Homes Sell and Others Sit
The defining feature of this market is limited depth of buyer demand. Some homes continue to generate strong interest, and in certain cases, multiple offers. But when a property doesn't resonate with a broad group of buyers, there is often little additional demand waiting behind that initial interest. That's producing increasingly property-specific and inconsistent outcomes, with tougher negotiations both at the time of offer and when issues surface during the subject period.
You can see it in the price bands themselves. In North Vancouver, homes under $750,000 posted a 20.4% sales-to-active ratio in July, the strongest of any bracket, while anything above $3M slowed to 11.8%. In West Vancouver, the pattern holds: the sub-$1M range saw a 17.8% ratio, while the $4M-$5M segment managed just 3.3%. Outcomes are coming down to the specifics of each home and each offer rather than any single market-wide trend.
July 2026 Stats
North Vancouver
| Metric | July 2026 | July 2025 | % Chg |
|---|---|---|---|
| Sales | 152 | 190 | ▼ 20.0% |
| New Listings | 384 | 466 | ▼ 17.6% |
| Active Inventory | 985 | 1,113 | ▼ 11.5% |
| Sales-to-Active Ratio | 15.4% (Balanced) | 17.0% | ▼ 9.9% |
| Sale Price / Original List Price | 96.2% | 97.1% | ▼ 0.9% |
| Days on Market | 24 | 18 | ▲ 33.3% |
| MLS® HPI Price, Detached | $2,078,200 | $2,187,900 | ▼ 5.0% |
| MLS® HPI Price, Condo | $785,700 | $817,100 | ▼ 4.4% |
| MLS® HPI Price, Townhome | $1,237,300 | $1,315,800 | ▼ 6.0% |
Sales-to-Active Ratio by Property Type: Detached 15.2%, Apartments 15.8%, Townhomes 15.8%
| Price Range | Sales-to-Active Ratio |
|---|---|
| Under $750K | 20.4% |
| $750K - $1M | 17.3% |
| $1M - $1.5M | 12.9% |
| $1.5M - $2M | 17.1% |
| $2M - $2.5M | 11.4% |
| $2.5M - $3M | 12.5% |
| Over $3M | 11.8% |
West Vancouver
| Metric | July 2026 | July 2025 | % Chg |
|---|---|---|---|
| Sales | 55 | 60 | ▼ 8.3% |
| New Listings | 160 | 205 | ▼ 22.0% |
| Active Inventory | 671 | 765 | ▼ 12.3% |
| Sales-to-Active Ratio | 8.2% (Buyer Favouring) | 7.8% | ▲ 5.1% |
| Sale Price / Original List Price | 92.1% | 92.7% | ▼ 0.6% |
| Days on Market | 30 | 32 | ▼ 6.3% |
| MLS® HPI Price, Detached | $2,897,500 | $3,172,600 | ▼ 8.7% |
| MLS® HPI Price, Condo | $1,104,000 | $1,276,900 | ▼ 13.5% |
| MLS® HPI Price, Townhome | n/a | n/a | -- |
Sales-to-Active Ratio by Property Type: Detached 7.0%, Apartments 11.7%, Townhomes 14.3%
| Price Range | Sales-to-Active Ratio |
|---|---|
| Under $1M | 17.8% |
| $1M - $2M | 9.2% |
| $2M - $3M | 8.3% |
| $3M - $4M | 7.0% |
| $4M - $5M | 3.3% |
| $5M - $6M | 9.3% |
| Over $6M | 6.7% |
Looking Ahead: Strategic Advice
Attention is starting to shift toward September, which typically brings a seasonal increase in listing activity. A number of those sellers will also become buyers, which naturally adds to overall market activity. Whether that translates into stronger, more consistent demand remains to be seen, but September should provide a clearer picture of how both sides of the market are positioned heading into fall.
For Sellers: North Vancouver's 15.4% sales-to-active ratio shows the market has cooled from balanced toward more cautious, so pricing sharply from day one matters more than ever, particularly outside the sub-$750K range where competition is strongest. In West Vancouver, the 8.2% ratio and continued price softening in condos mean patience and a realistic starting price carry even more weight right now.
For Buyers: You're negotiating from a position of strength across the board, but especially above $3M in North Van and in the $4M-$5M range in West Van, where sales-to-active ratios are the lowest of any segment. That said, well-priced homes in the busier bands, like North Van's sub-$750K range, are still moving quickly and occasionally drawing multiple offers, so when you find the right fit, be ready to move.
Planning a move?
Every micro-neighbourhood and building on the North Shore is behaving differently right now. Whether you want to navigate current choices or need an accurate strategy to sell, I am here to help you translate the data.
Call/text or email me to book a 15-minute strategy session.
604-317-4464
Matt@RossettiRealty.ca

About Matt Council
Matt Council is a top-performing North Vancouver Realtor and West Van specialist with a background in finance. He moves beyond the sales hype to offer clients a data-driven, pressure-free approach to buying and selling real estate on the North Shore. Whether you are evaluating a presale in Lower Lonsdale or a detached home in Lynn Valley, Matt helps you understand the numbers behind the move.
Thinking of making a move? Let’s run the numbers.