
Market Update | Q2 [April - June] 2026
North Shore Market Balances Out, But Buyers Still Aren't Budging
June wrapped up the second quarter with a North Shore market that finally looks more balanced, as sales ticked up in both North and West Vancouver amongst tightening inventory. But let's be clear about what that balance actually means: it's coming from tighter supply as a result of fewer new listings, not from buyers suddenly feeling more confident. Across both markets, the crowd shopping right now is still moving carefully, weighing value, condition, and risk before they commit, and that's likely to carry us straight through the summer.
At a Glance
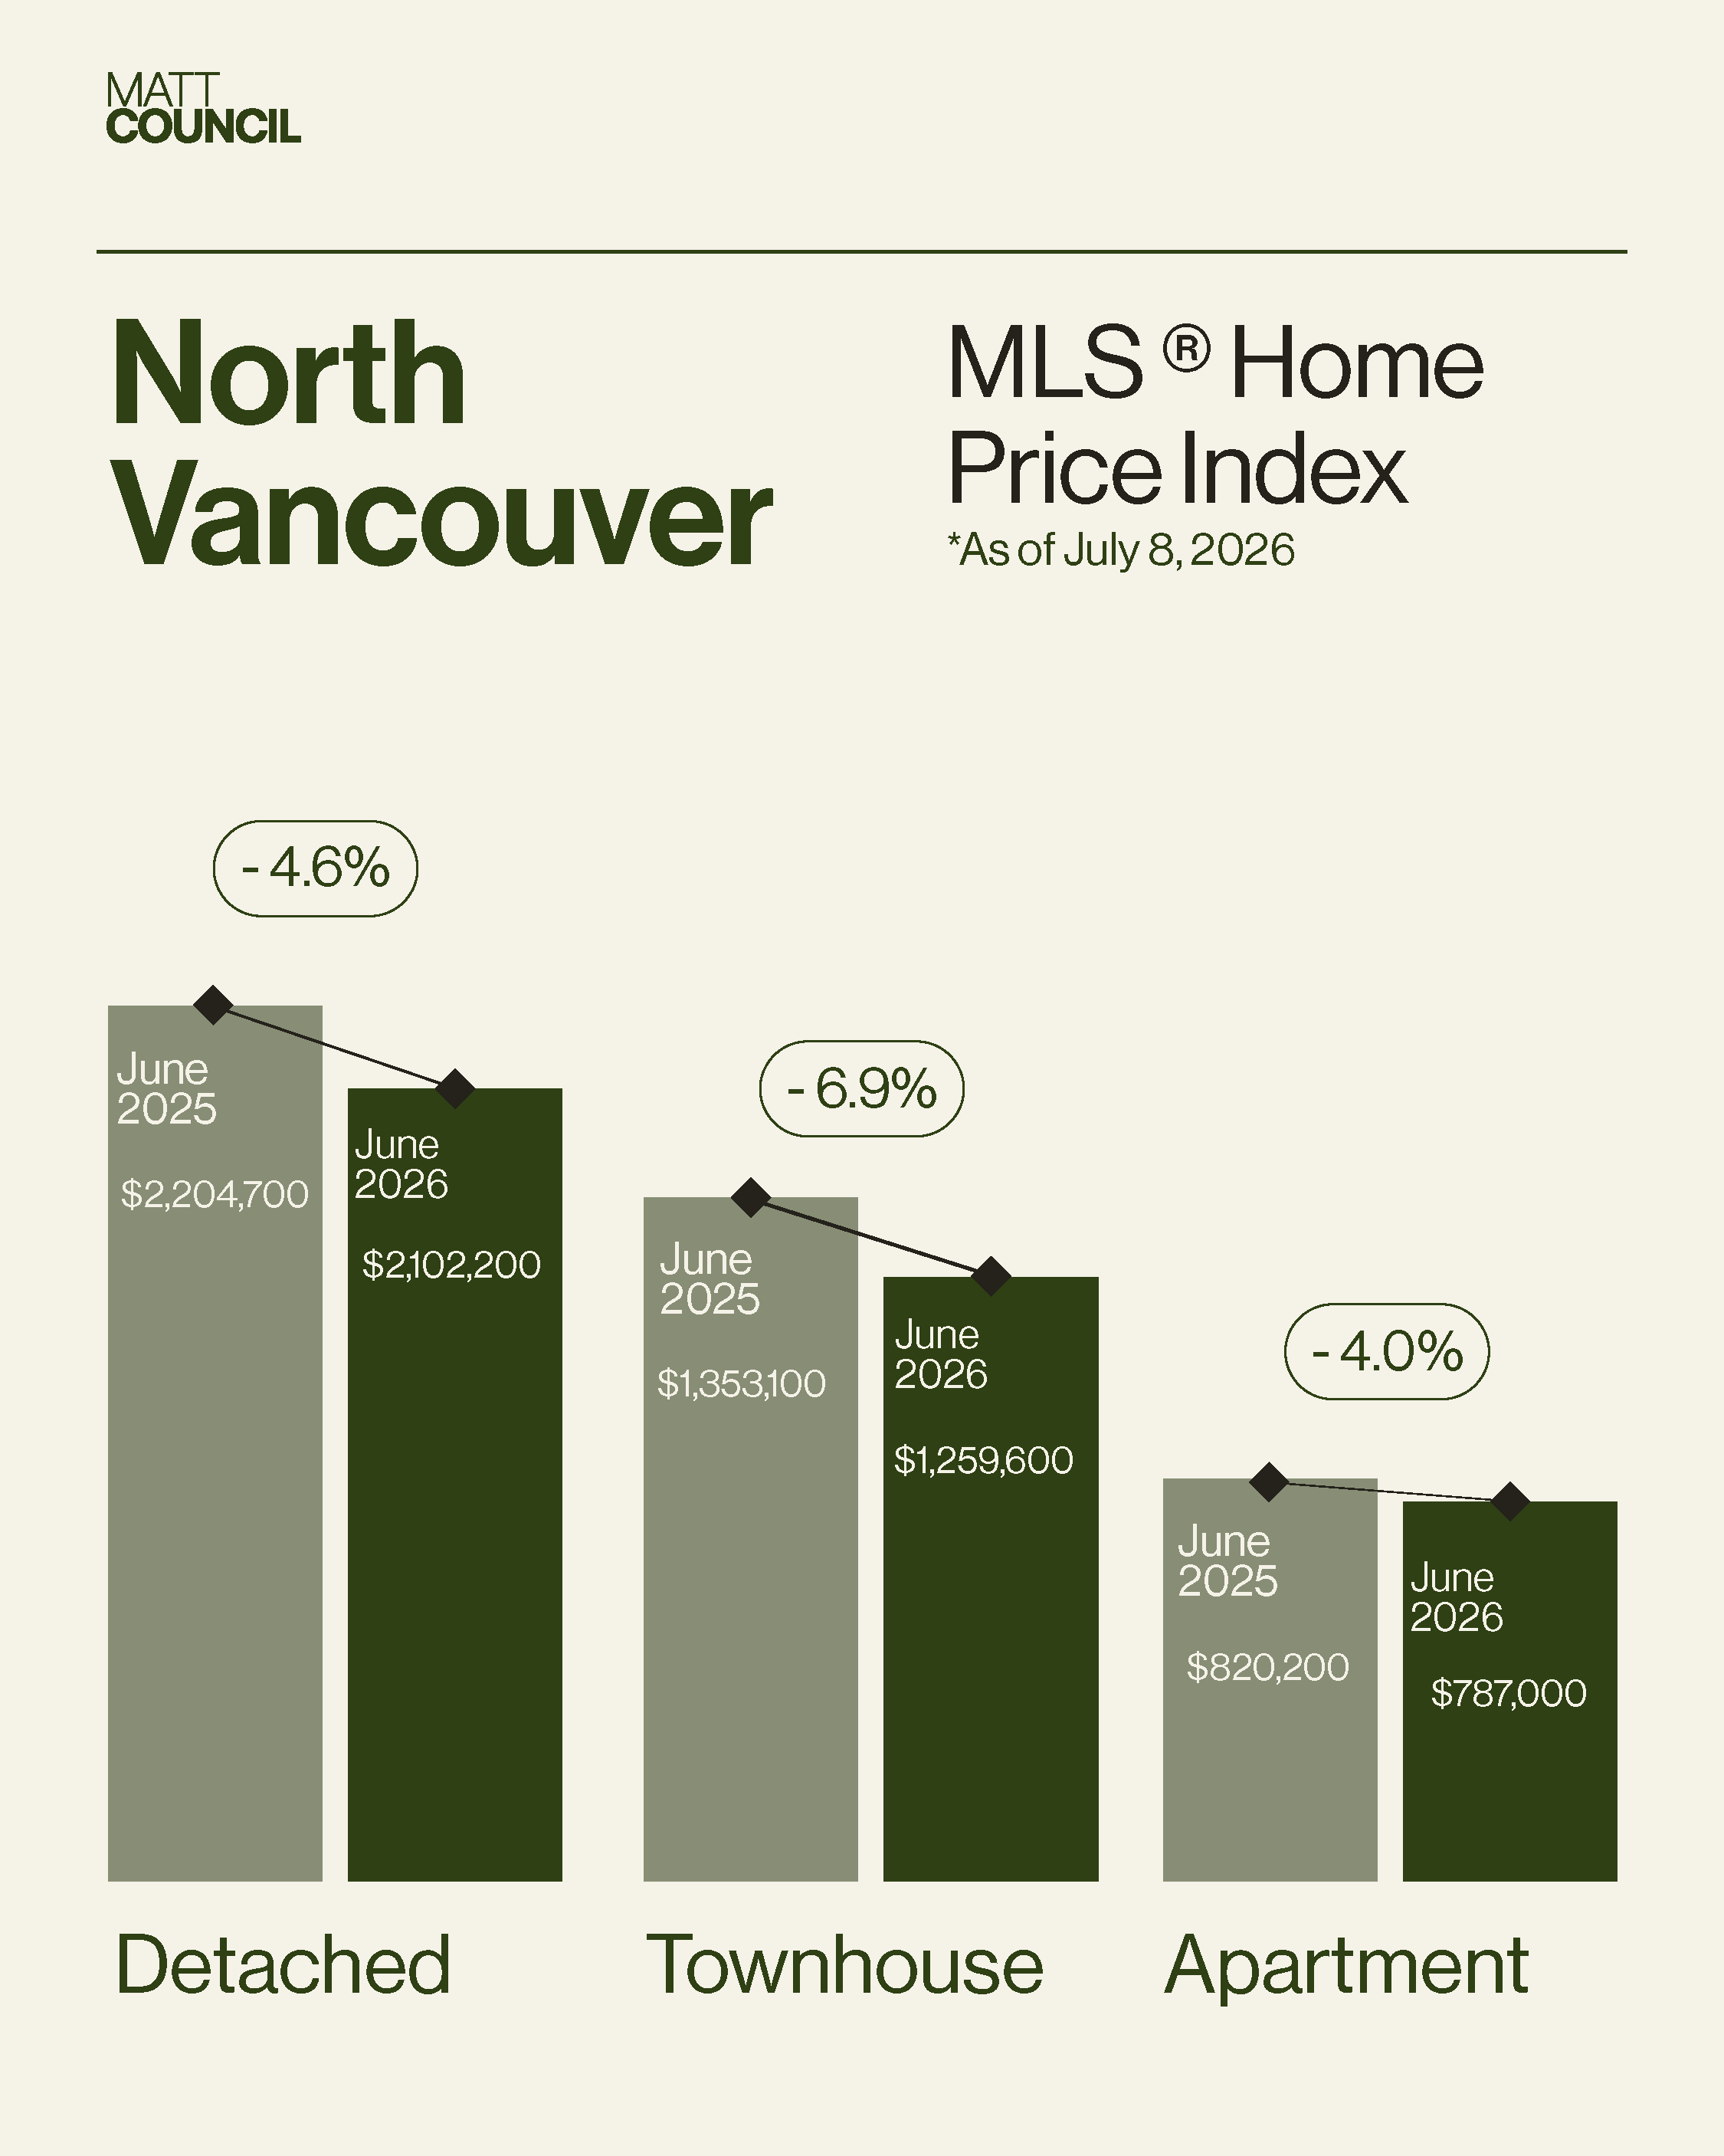
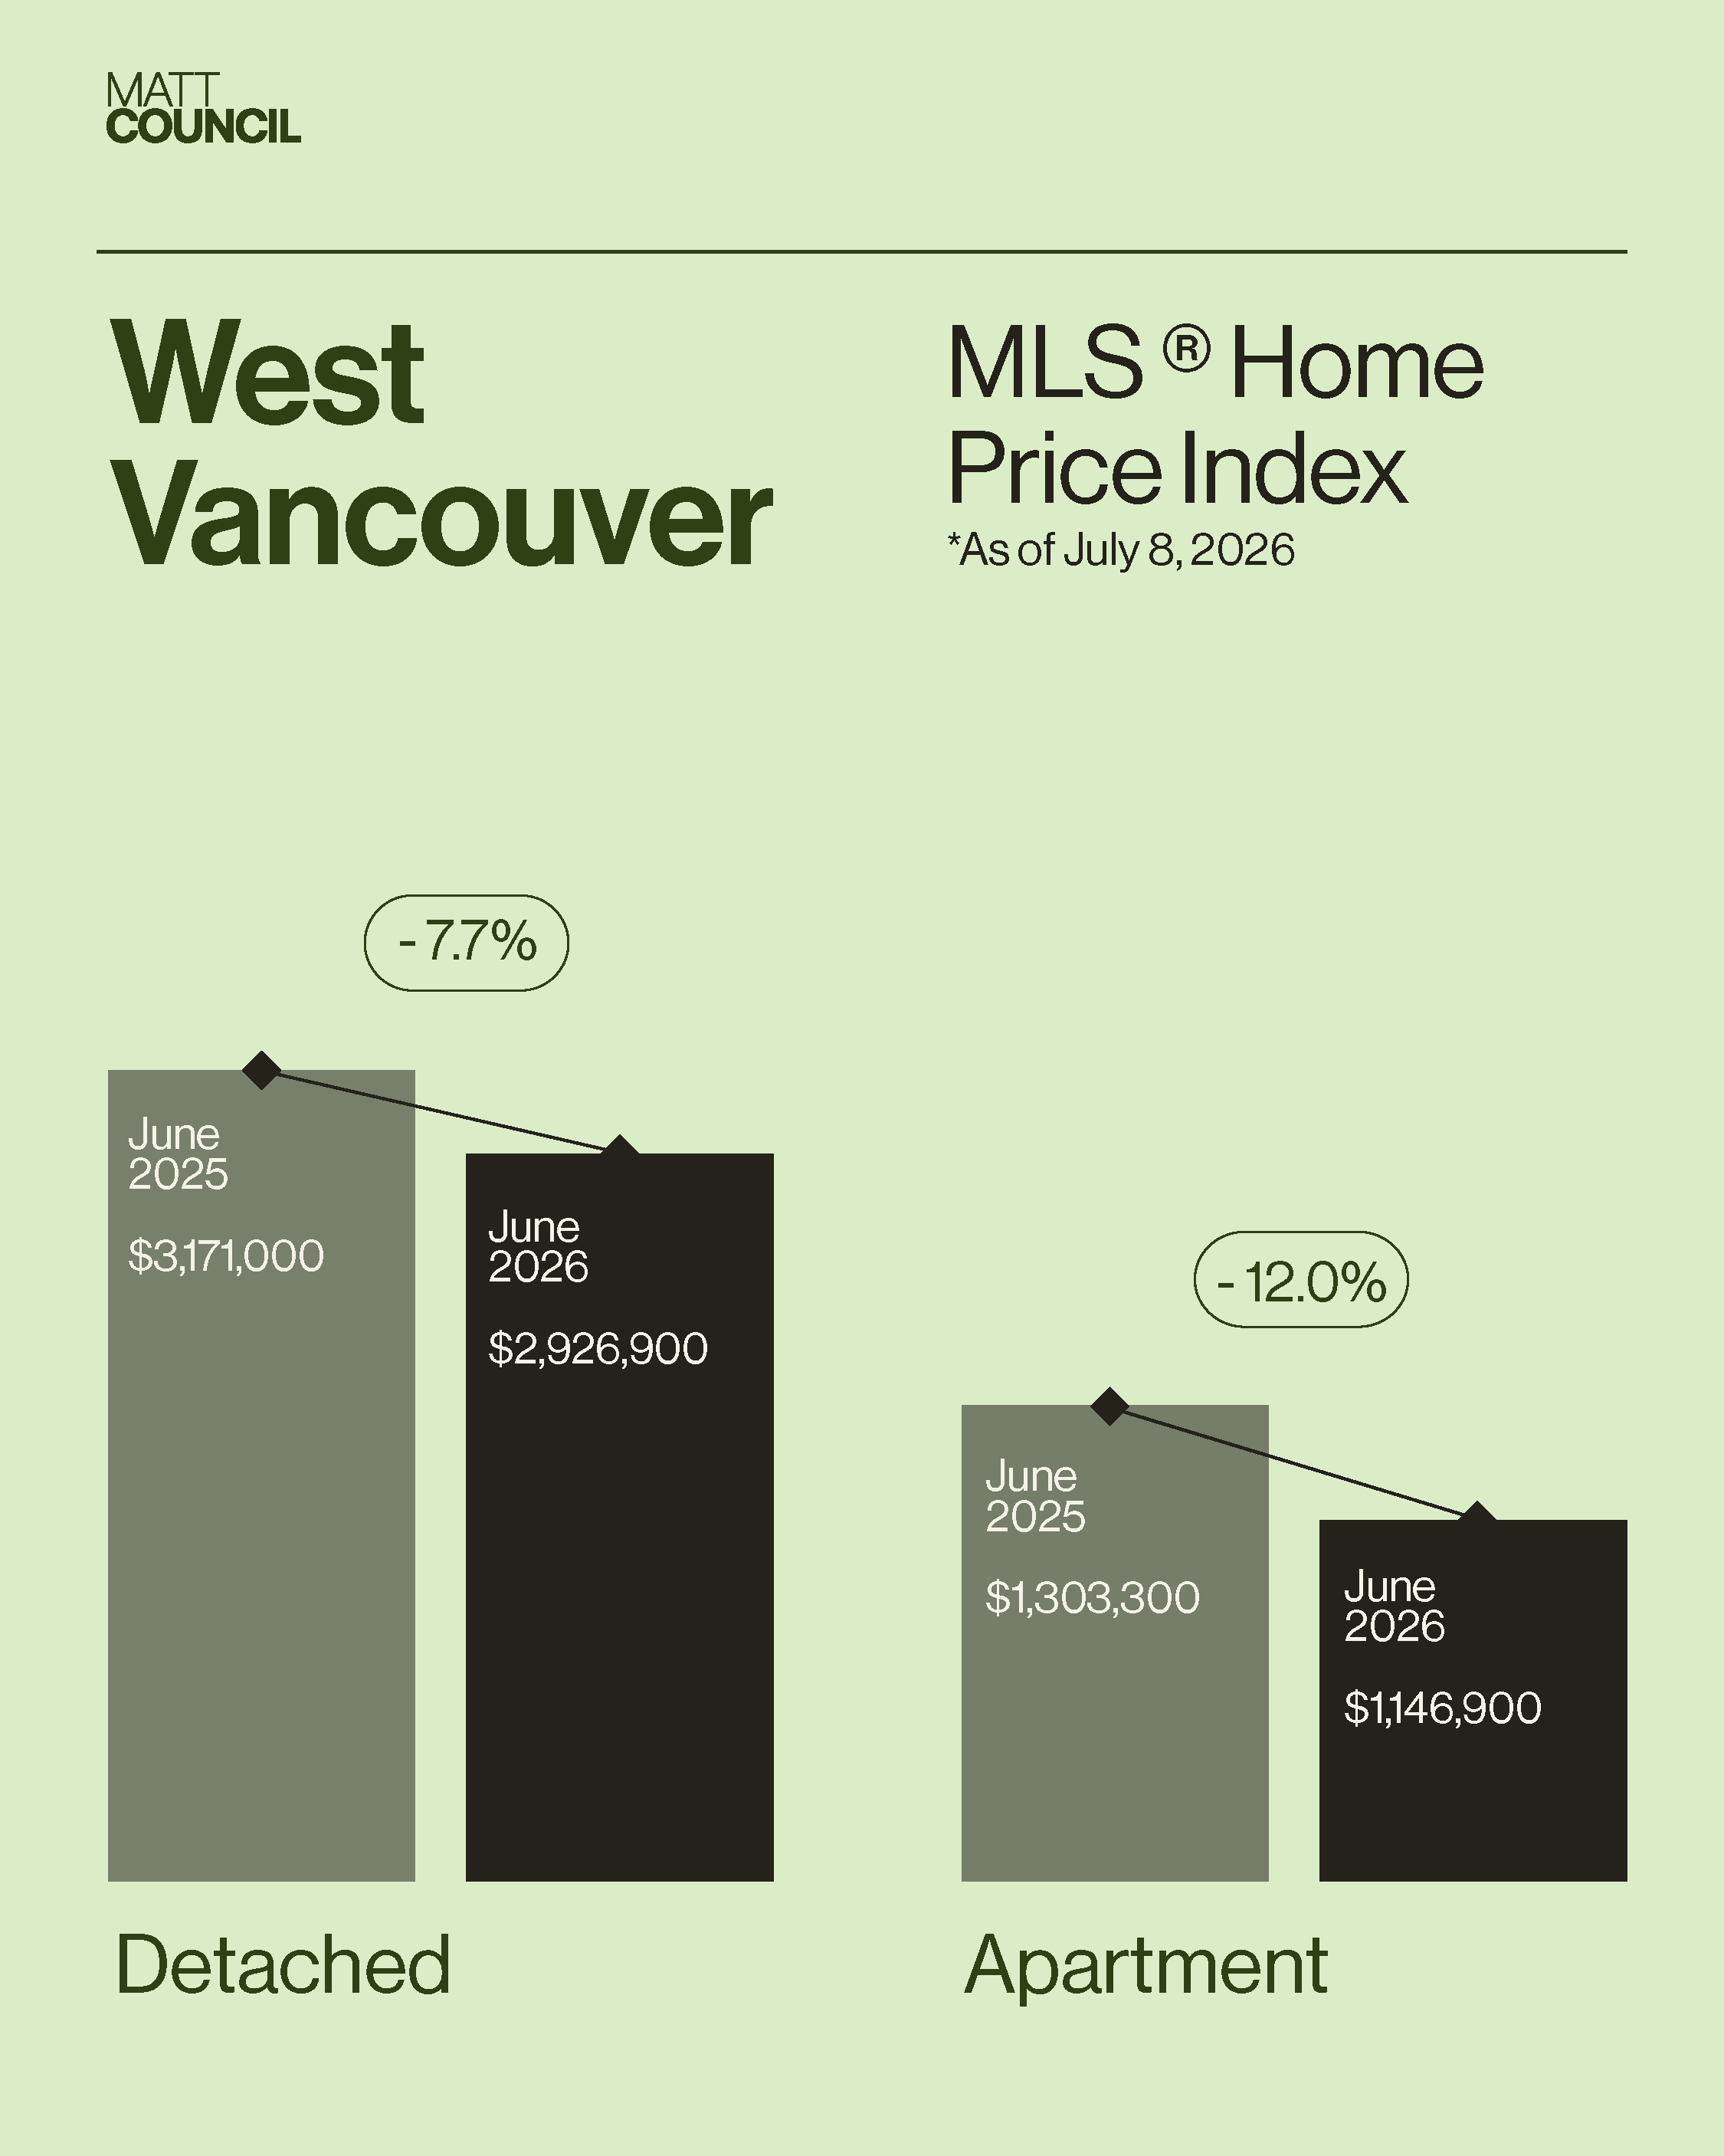
- Sales are up, prices are still soft: North Vancouver sales rose 9.1% year-over-year to 216 in June, while benchmark prices slipped across the board (houses down 4.6%, townhomes down 6.9%, condos down 4.0%). West Vancouver sales jumped 17.3% to 61, with houses down 7.7% and condos down 12.0%.
- A real gap in market tightness: North Vancouver's overall sales-to-active ratio sat at 20.8%, a genuinely balanced market, while West Vancouver came in at 8.7%, still solidly buyer-favouring. That's the clearest signal of how differently these two markets are behaving right now.
- The $2M-$2.5M sweet spot: In North Van, homes priced $2M-$2.5M posted a 28.6% sales-to-active ratio (meaning nearly 3 in 10 of those listings sold in June), the strongest of any price band, while listings above $3M managed just 9.2%.
- Inventory is shrinking, not exploding: Total listings fell by double digits in both markets, North Vancouver down 10.1% to 1,038 and West Vancouver down 10.5% to 699. That's the main reason things feel more balanced this summer, not a surge in demand.
North Van Tightens, West Van Perks Up, Neither Is Racing
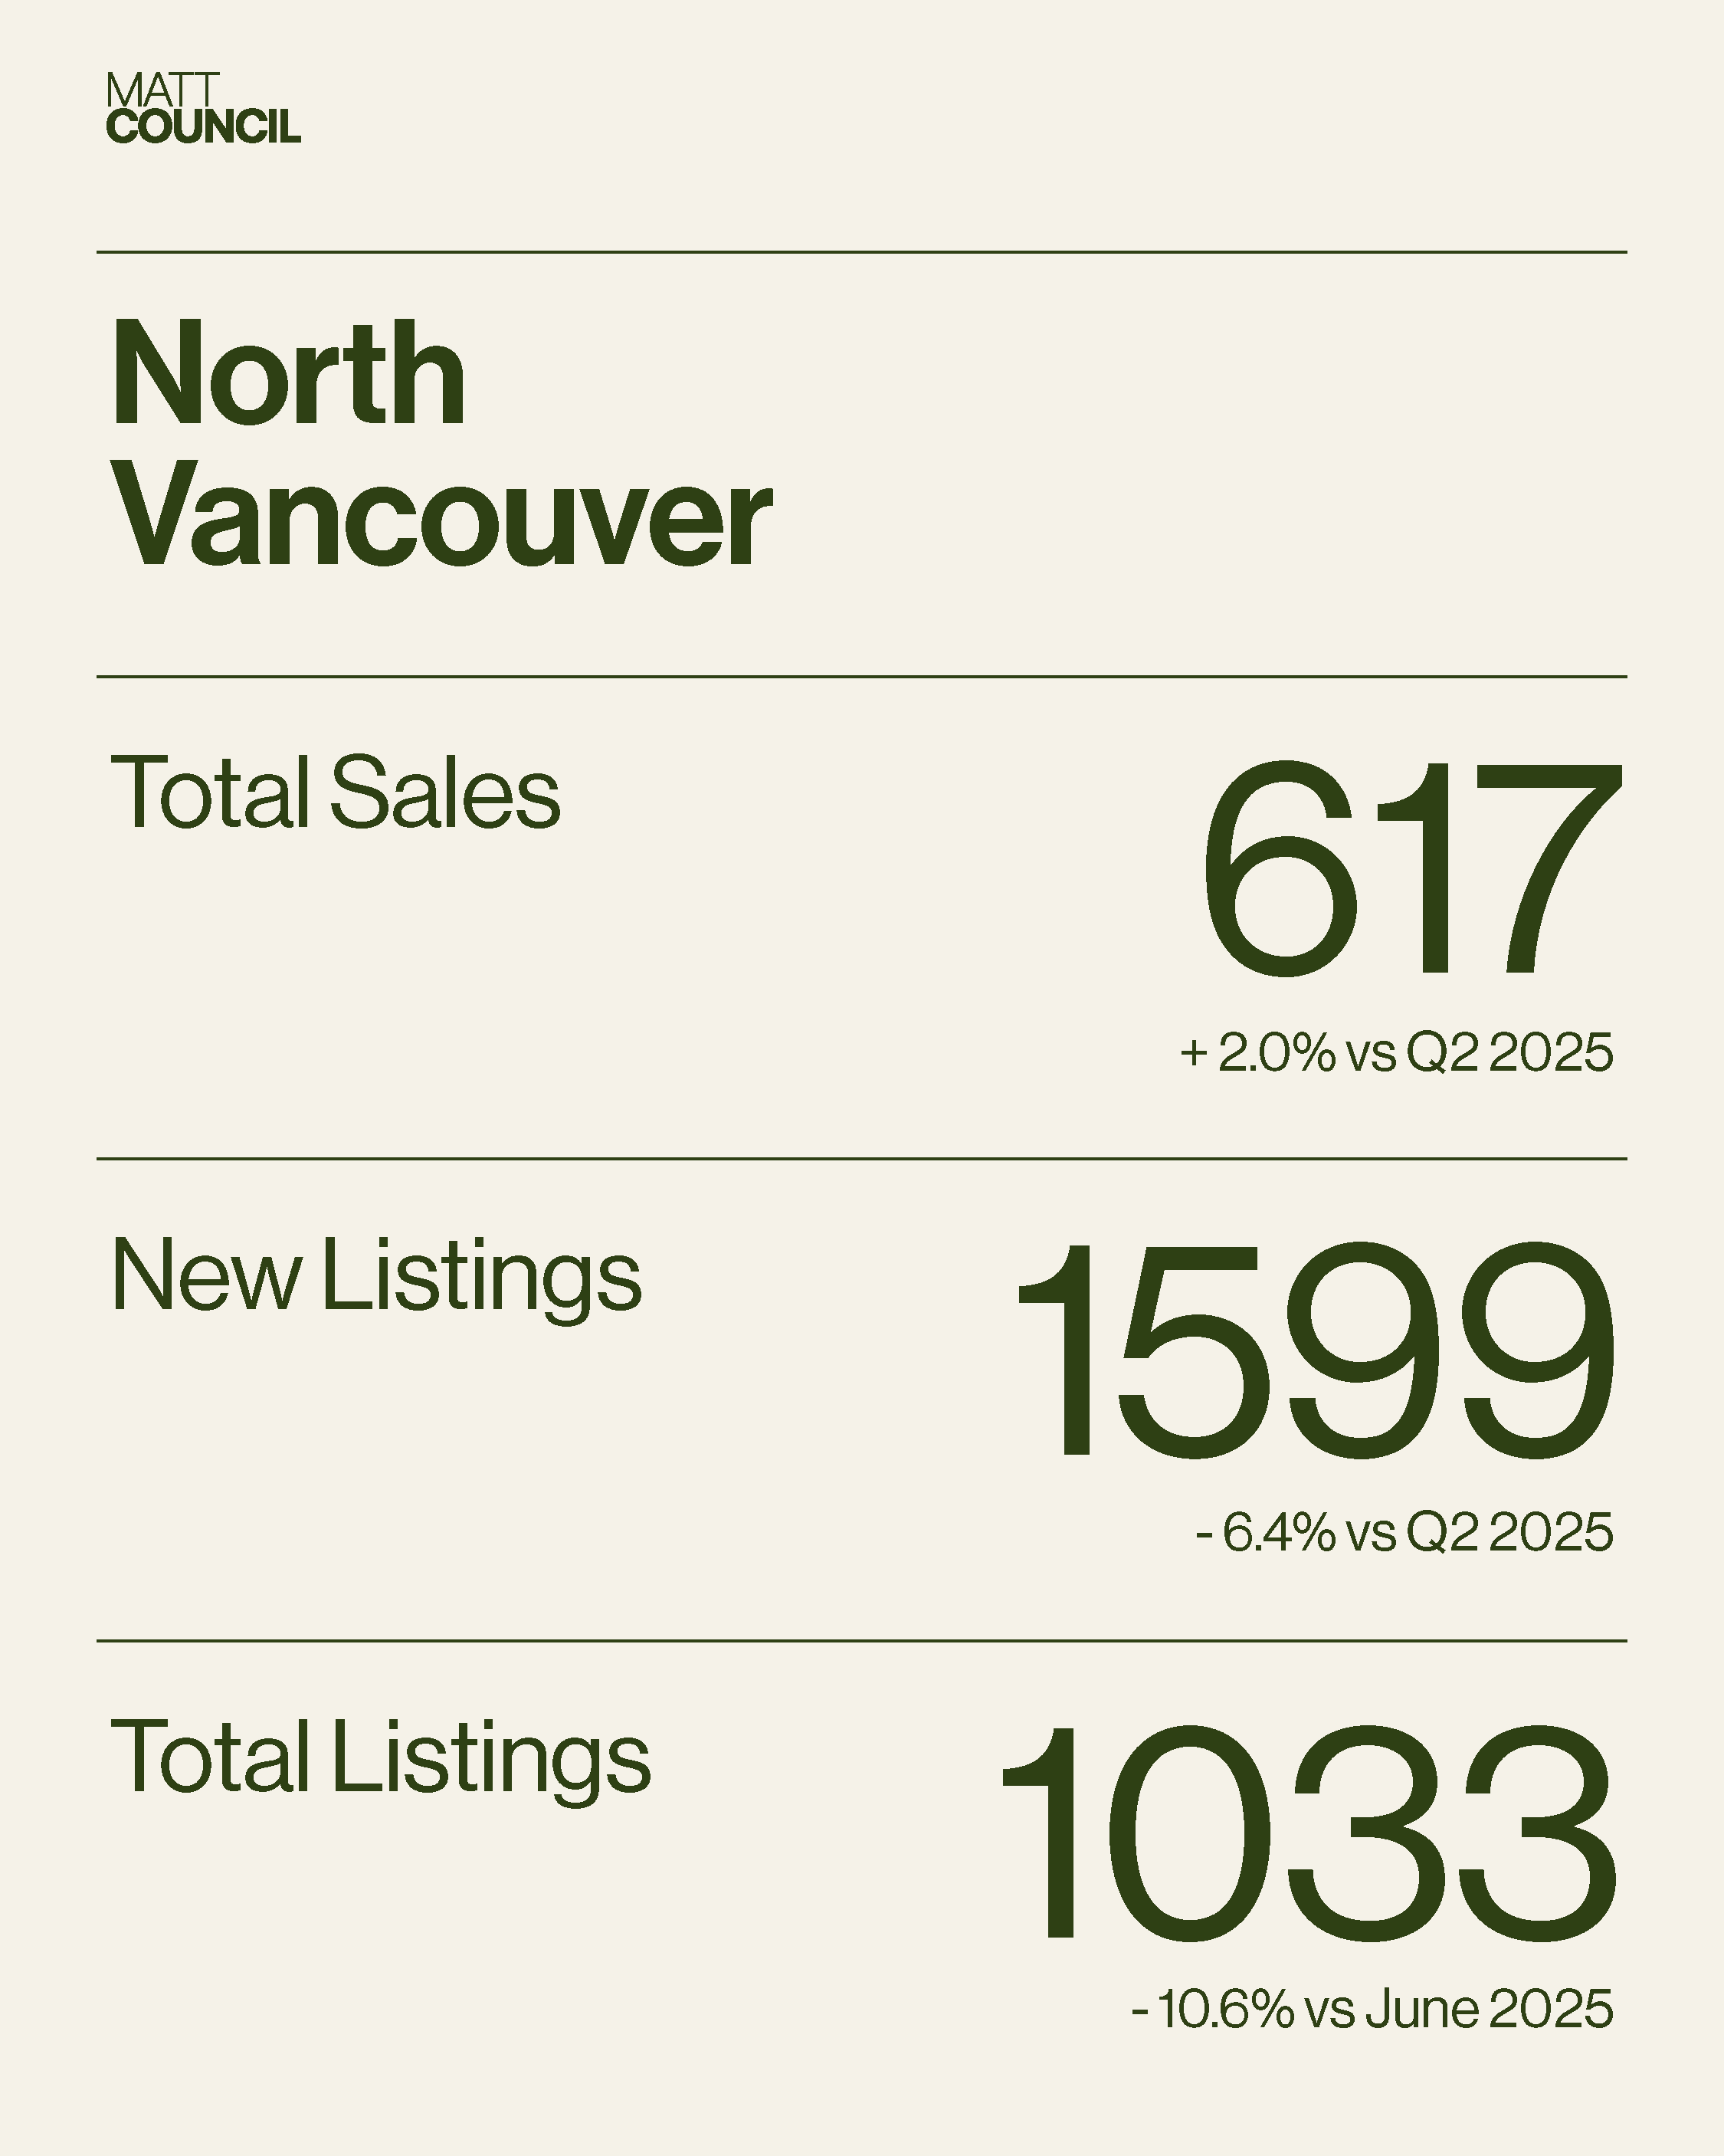
In North Vancouver, shrinking supply did most of the work toward a more balanced market. New listings fell 11.3% year-over-year to 461, and total homes for sale dropped to 1,038, a 10.1% decline from last June. That pushed the sales-to-active ratio up to 20.8%, genuinely balanced territory. Sellers are also getting slightly closer to their asking price, with the sale-to-original-list-price ratio at 96.8%, down only half a point from last year. Even so, benchmark prices softened across every property type (houses down 4.6% to $2,102,200, townhomes down 6.9% to $1,259,600, and condos down 4.0% to $787,000), which tells me sellers are still negotiating from a position of patience, even with fewer competing listings.
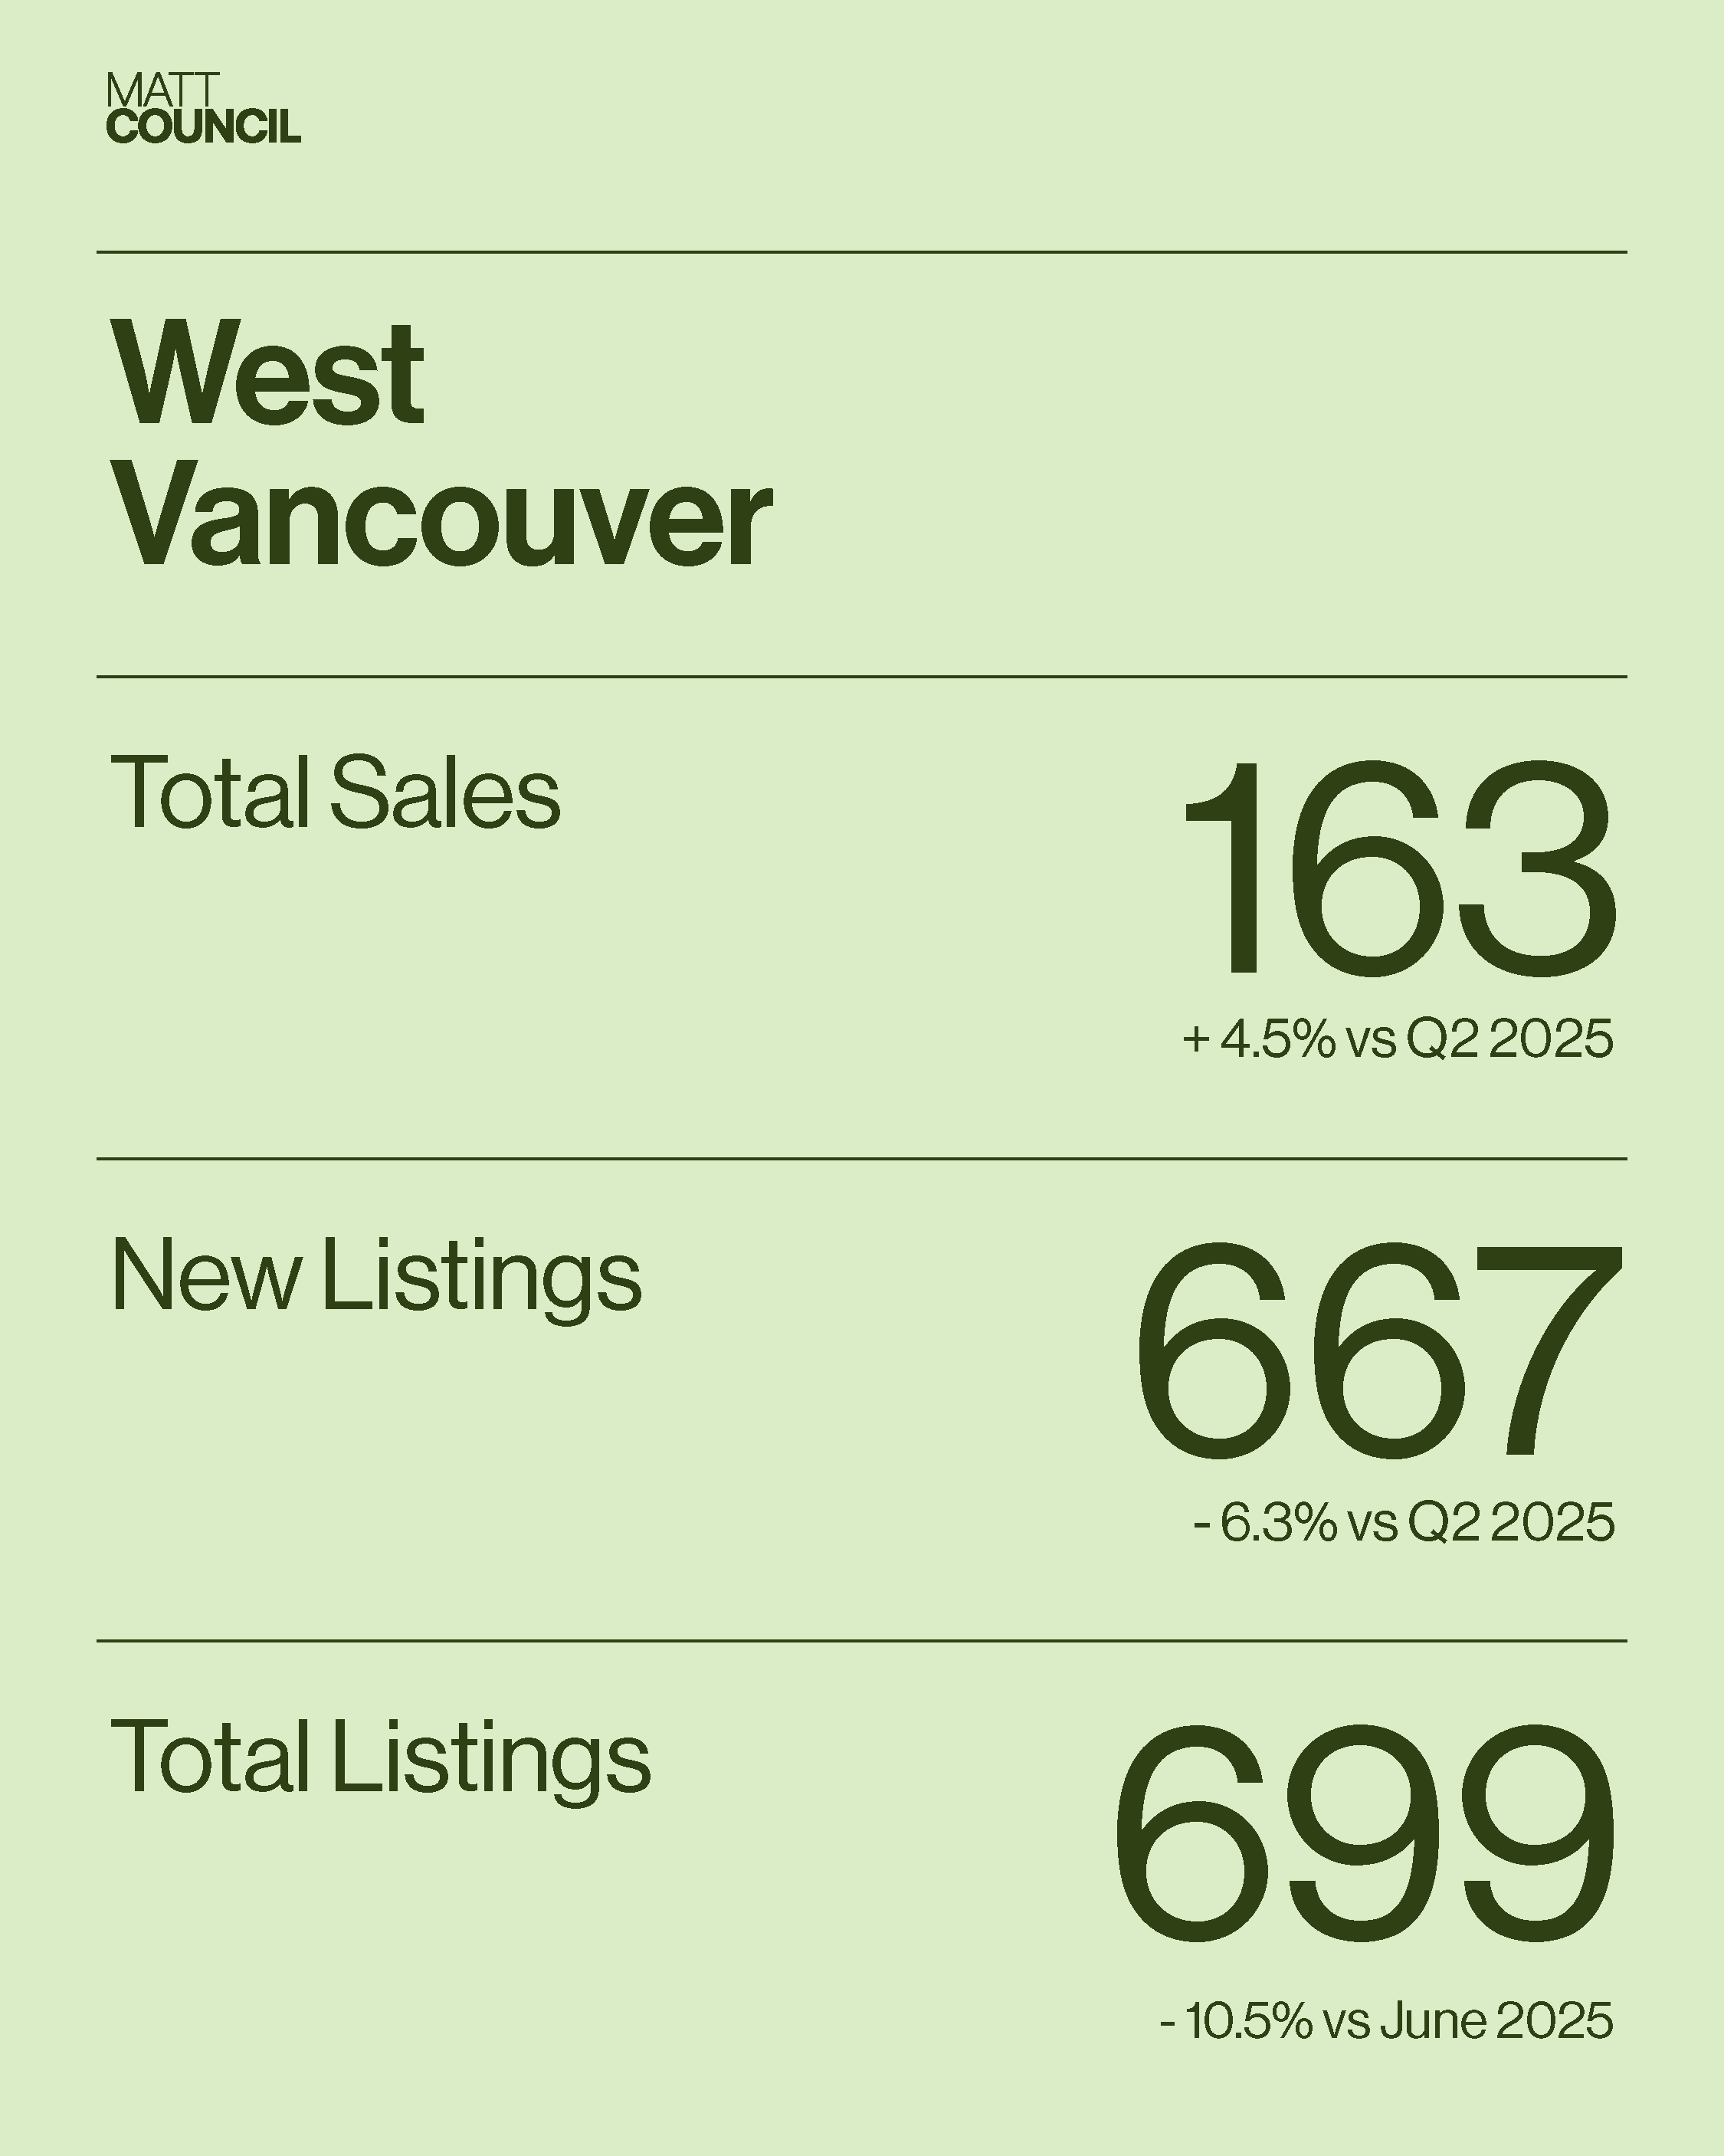
West Vancouver told a different story. New listings fell 7.2% to 206 and total inventory dropped 10.5% to 699, alongside a healthy 17.3% jump in sales. But the overall sales-to-active ratio still sat at 8.7%, which puts West Van solidly in buyer-favouring territory, meaning buyers still have the upper hand on negotiating room and timeline. The sale-to-original-list-price ratio slipped to 93.8%, and pricing pressure hasn't let up either, with detached benchmarks down 7.7% to $2,926,900 and condos down 12.0% to $1,146,900 (townhome data wasn't reliable enough to report this month).
Pricing Strategy Is Beating the Calendar
The clearest thread running through Q2 is inconsistency, and June didn't break the pattern. Some homes are selling quickly, occasionally with multiple offers, while others sit despite looking competitively priced on paper. The difference increasingly comes down to pricing strategy, presentation, and how a buyer perceives the value on offer, not the overall state of the market.
You can see it in the price bands themselves. In North Vancouver, the $2M-$2.5M range posted a 28.6% sales-to-active ratio in June, easily the strongest of any bracket, while anything above $3M slowed to 9.2%. In West Vancouver, the split is even sharper: the sub-$2M range is seeing sales-to-active ratios of 14-17%, while the over-$6M segment managed just 1.6%. Buyers at the top end are being the most selective of anyone right now, and North Vancouver's overall balance compared to West Vancouver's buyer-favouring conditions suggests that selectivity runs deeper in West Van across the board, not just at the top.
June 2026 Stats
North Vancouver
| Metric | June 2026 | June 2025 | % Chg |
|---|---|---|---|
| Sales | 216 | 198 | ▲ 9.1% |
| New Listings | 461 | 520 | ▼ 11.3% |
| Active Inventory | 1,038 | 1,155 | ▼ 10.1% |
| Sales-to-Active Ratio | 20.8% (Balanced) | 17.0% | ▲ 21.6% |
| Sale Price / Original List Price | 96.8% | 97.4% | ▼ 0.6% |
| Days on Market | 14 | 18 | ▼ 22.2% |
| MLS® HPI Price, Detached | $2,102,200 | $2,204,700 | ▼ 4.6% |
| MLS® HPI Price, Condo | $787,000 | $820,200 | ▼ 4.0% |
| MLS® HPI Price, Townhome | $1,259,600 | $1,353,100 | ▼ 6.9% |
Sales-to-Active Ratio by Property Type: Detached 21.6%, Apartments 20.8%, Townhomes 18.0%
| Price Range | Sales-to-Active Ratio |
|---|---|
| Under $750K | 22.7% |
| $750K - $1M | 22.4% |
| $1M - $1.5M | 20.0% |
| $1.5M - $2M | 21.9% |
| $2M - $2.5M | 28.6% |
| $2.5M - $3M | 17.6% |
| Over $3M | 9.2% |
West Vancouver
| Metric | June 2026 | June 2025 | % Chg |
|---|---|---|---|
| Sales | 61 | 52 | ▲ 17.3% |
| New Listings | 206 | 222 | ▼ 7.2% |
| Active Inventory | 699 | 781 | ▼ 10.5% |
| Sales-to-Active Ratio | 8.7% (Buyer Favouring) | 6.7% | ▲ 29.9% |
| Sale Price / Original List Price | 93.8% | 95.1% | ▼ 1.4% |
| Days on Market | 31 | 21 | ▲ 47.6% |
| MLS® HPI Price, Detached | $2,926,900 | $3,171,000 | ▼ 7.7% |
| MLS® HPI Price, Condo | $1,146,900 | $1,303,300 | ▼ 12.0% |
| MLS® HPI Price, Townhome | n/a | n/a | -- |
Sales-to-Active Ratio by Property Type: Detached 7.9%, Apartments 12.3%, Townhomes 6.7%
| Price Range | Sales-to-Active Ratio |
|---|---|
| Under $1M | 14.0% |
| $1M - $2M | 16.8% |
| $2M - $3M | 10.1% |
| $3M - $4M | 8.7% |
| $4M - $5M | n/a |
| $5M - $6M | 11.9% |
| Over $6M | 1.6% |
Looking Ahead: Strategic Advice
As we move into the heart of summer, I expect activity to keep moderating on both sides. Fewer new listings should give sellers a bit more breathing room, but buyers still have enough choice and time to stay picky, especially in West Van.
For Sellers: North Vancouver's balanced 20.8% sales-to-active ratio shows that well-priced homes are still finding buyers, so pricing sharply from day one continues to pay off, particularly in the $2M-$2.5M range where competition is strongest. In West Vancouver, the 8.7% ratio and softer condo pricing mean patience and a realistic starting price matter even more right now.
For Buyers: You're negotiating from a position of strength across the board, but especially above $3M in North Van and above $6M in West Van, where sales-to-active ratios are the lowest of any segment. That said, well-priced homes in the busier bands, like North Van's $2M-$2.5M range, are still moving fast and occasionally drawing multiple offers, so when you find the right fit, be ready to move.
Planning a move?
Every micro-neighbourhood and building on the North Shore is behaving differently right now. Whether you want to navigate current choices or need an accurate strategy to sell, I am here to help you translate the data.
Call/text or email me to book a 15-minute strategy session.
604-317-4464
Matt@RossettiRealty.ca

About Matt Council
Matt Council is a top-performing North Vancouver Realtor and West Van specialist with a background in finance. He moves beyond the sales hype to offer clients a data-driven, pressure-free approach to buying and selling real estate on the North Shore. Whether you are evaluating a presale in Lower Lonsdale or a detached home in Lynn Valley, Matt helps you understand the numbers behind the move.
Thinking of making a move? Let’s run the numbers.