
Market Update | Q3 [July - September] 2026
A review of market trends and statistics for Q3 and September 2026.
Fall Activity Returns, Direction Doesn't
September brought the expected return of listings after a quiet summer, but the fall market hasn't yet settled into a clear direction. New listings rose from August in both North Vancouver and West Vancouver, though they stayed below last September's levels. Sales then went in opposite directions: North Vancouver dropped sharply while West Vancouver moved higher. With buyers staying selective and results varying widely from one property to the next, it remains hard to describe the North Shore as a single market.
At a Glance
- North Van sales slide: 126 homes sold, down 20.3% from last September and 30.8% below the 10-year average for the month.
- West Van moves the other way: 60 sales, up 17.6% year over year and 11.1% above the 10-year average, even with new listings down 36.4%.
- Condos stay weakest: North Vancouver apartment sales fell 47.5% from last September, and apartments sit at an 8.6% sales-to-active ratio versus 15.2% for detached homes.
- Inventory still elevated: North Vancouver ended September with 1,027 homes for sale, 28.1% above the 10-year average, while West Vancouver's 611 listings sit 8.9% above it.
North Van Slows, West Van Moves the Other Way
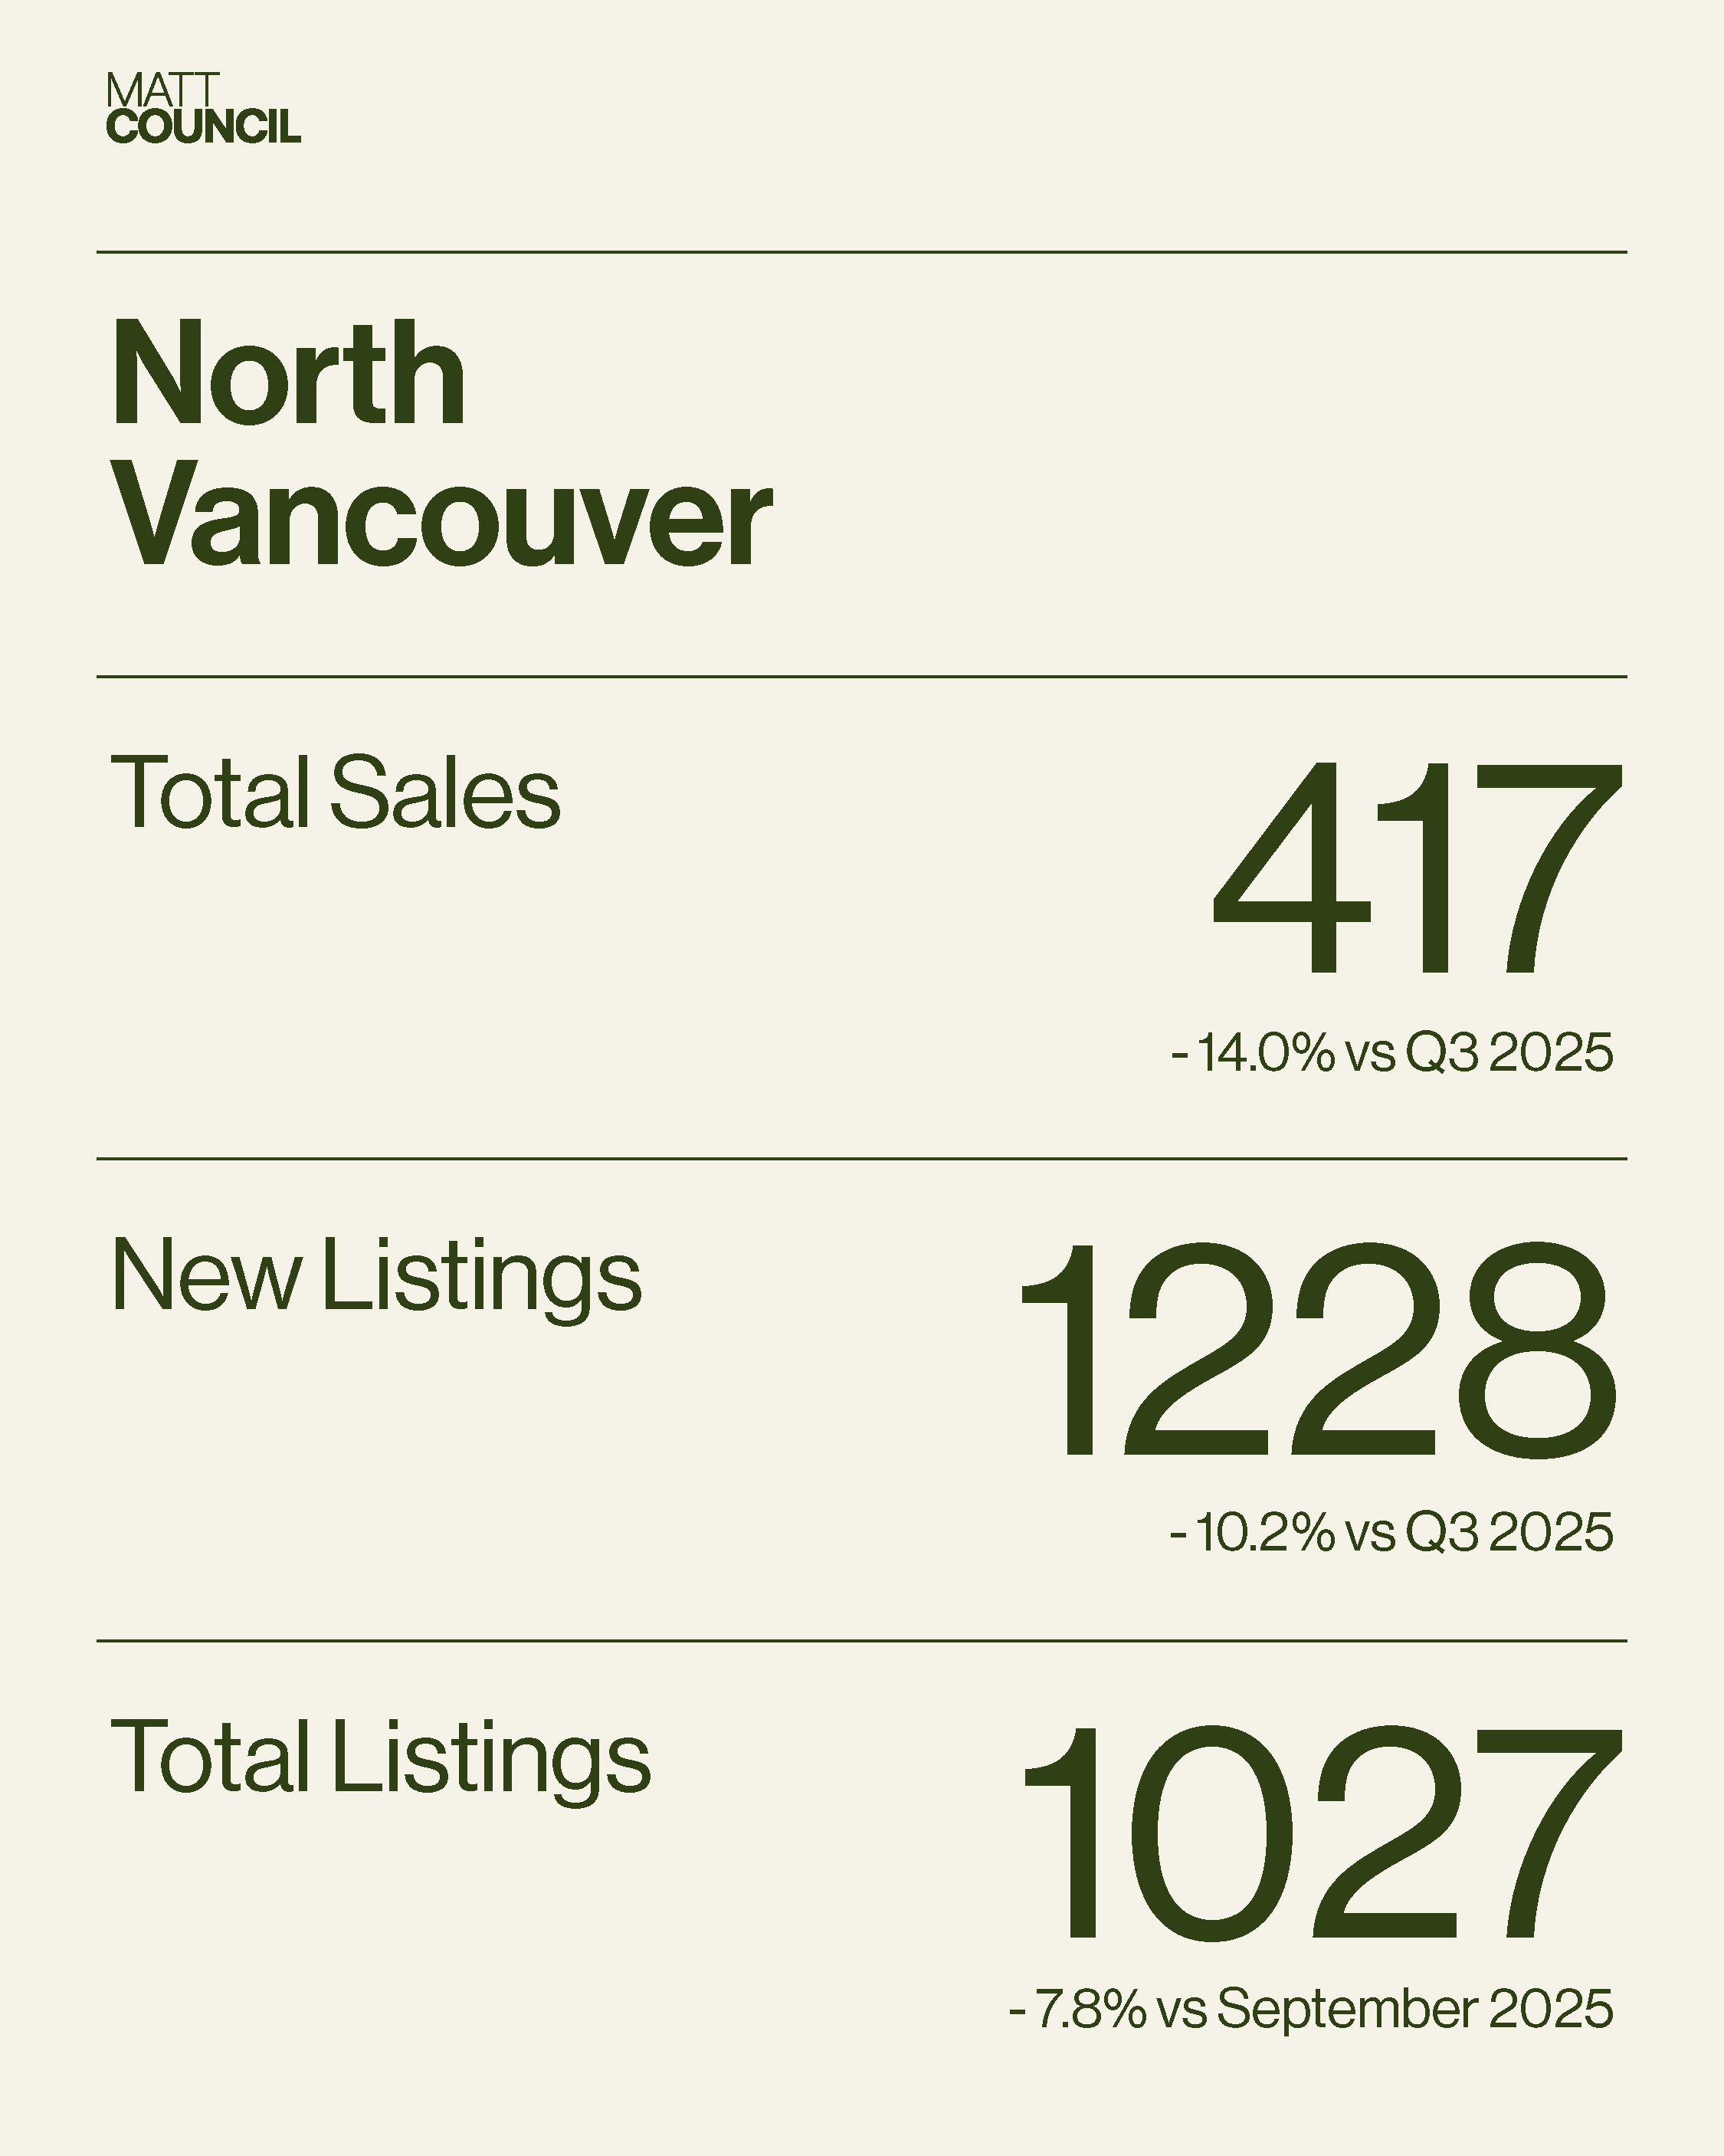
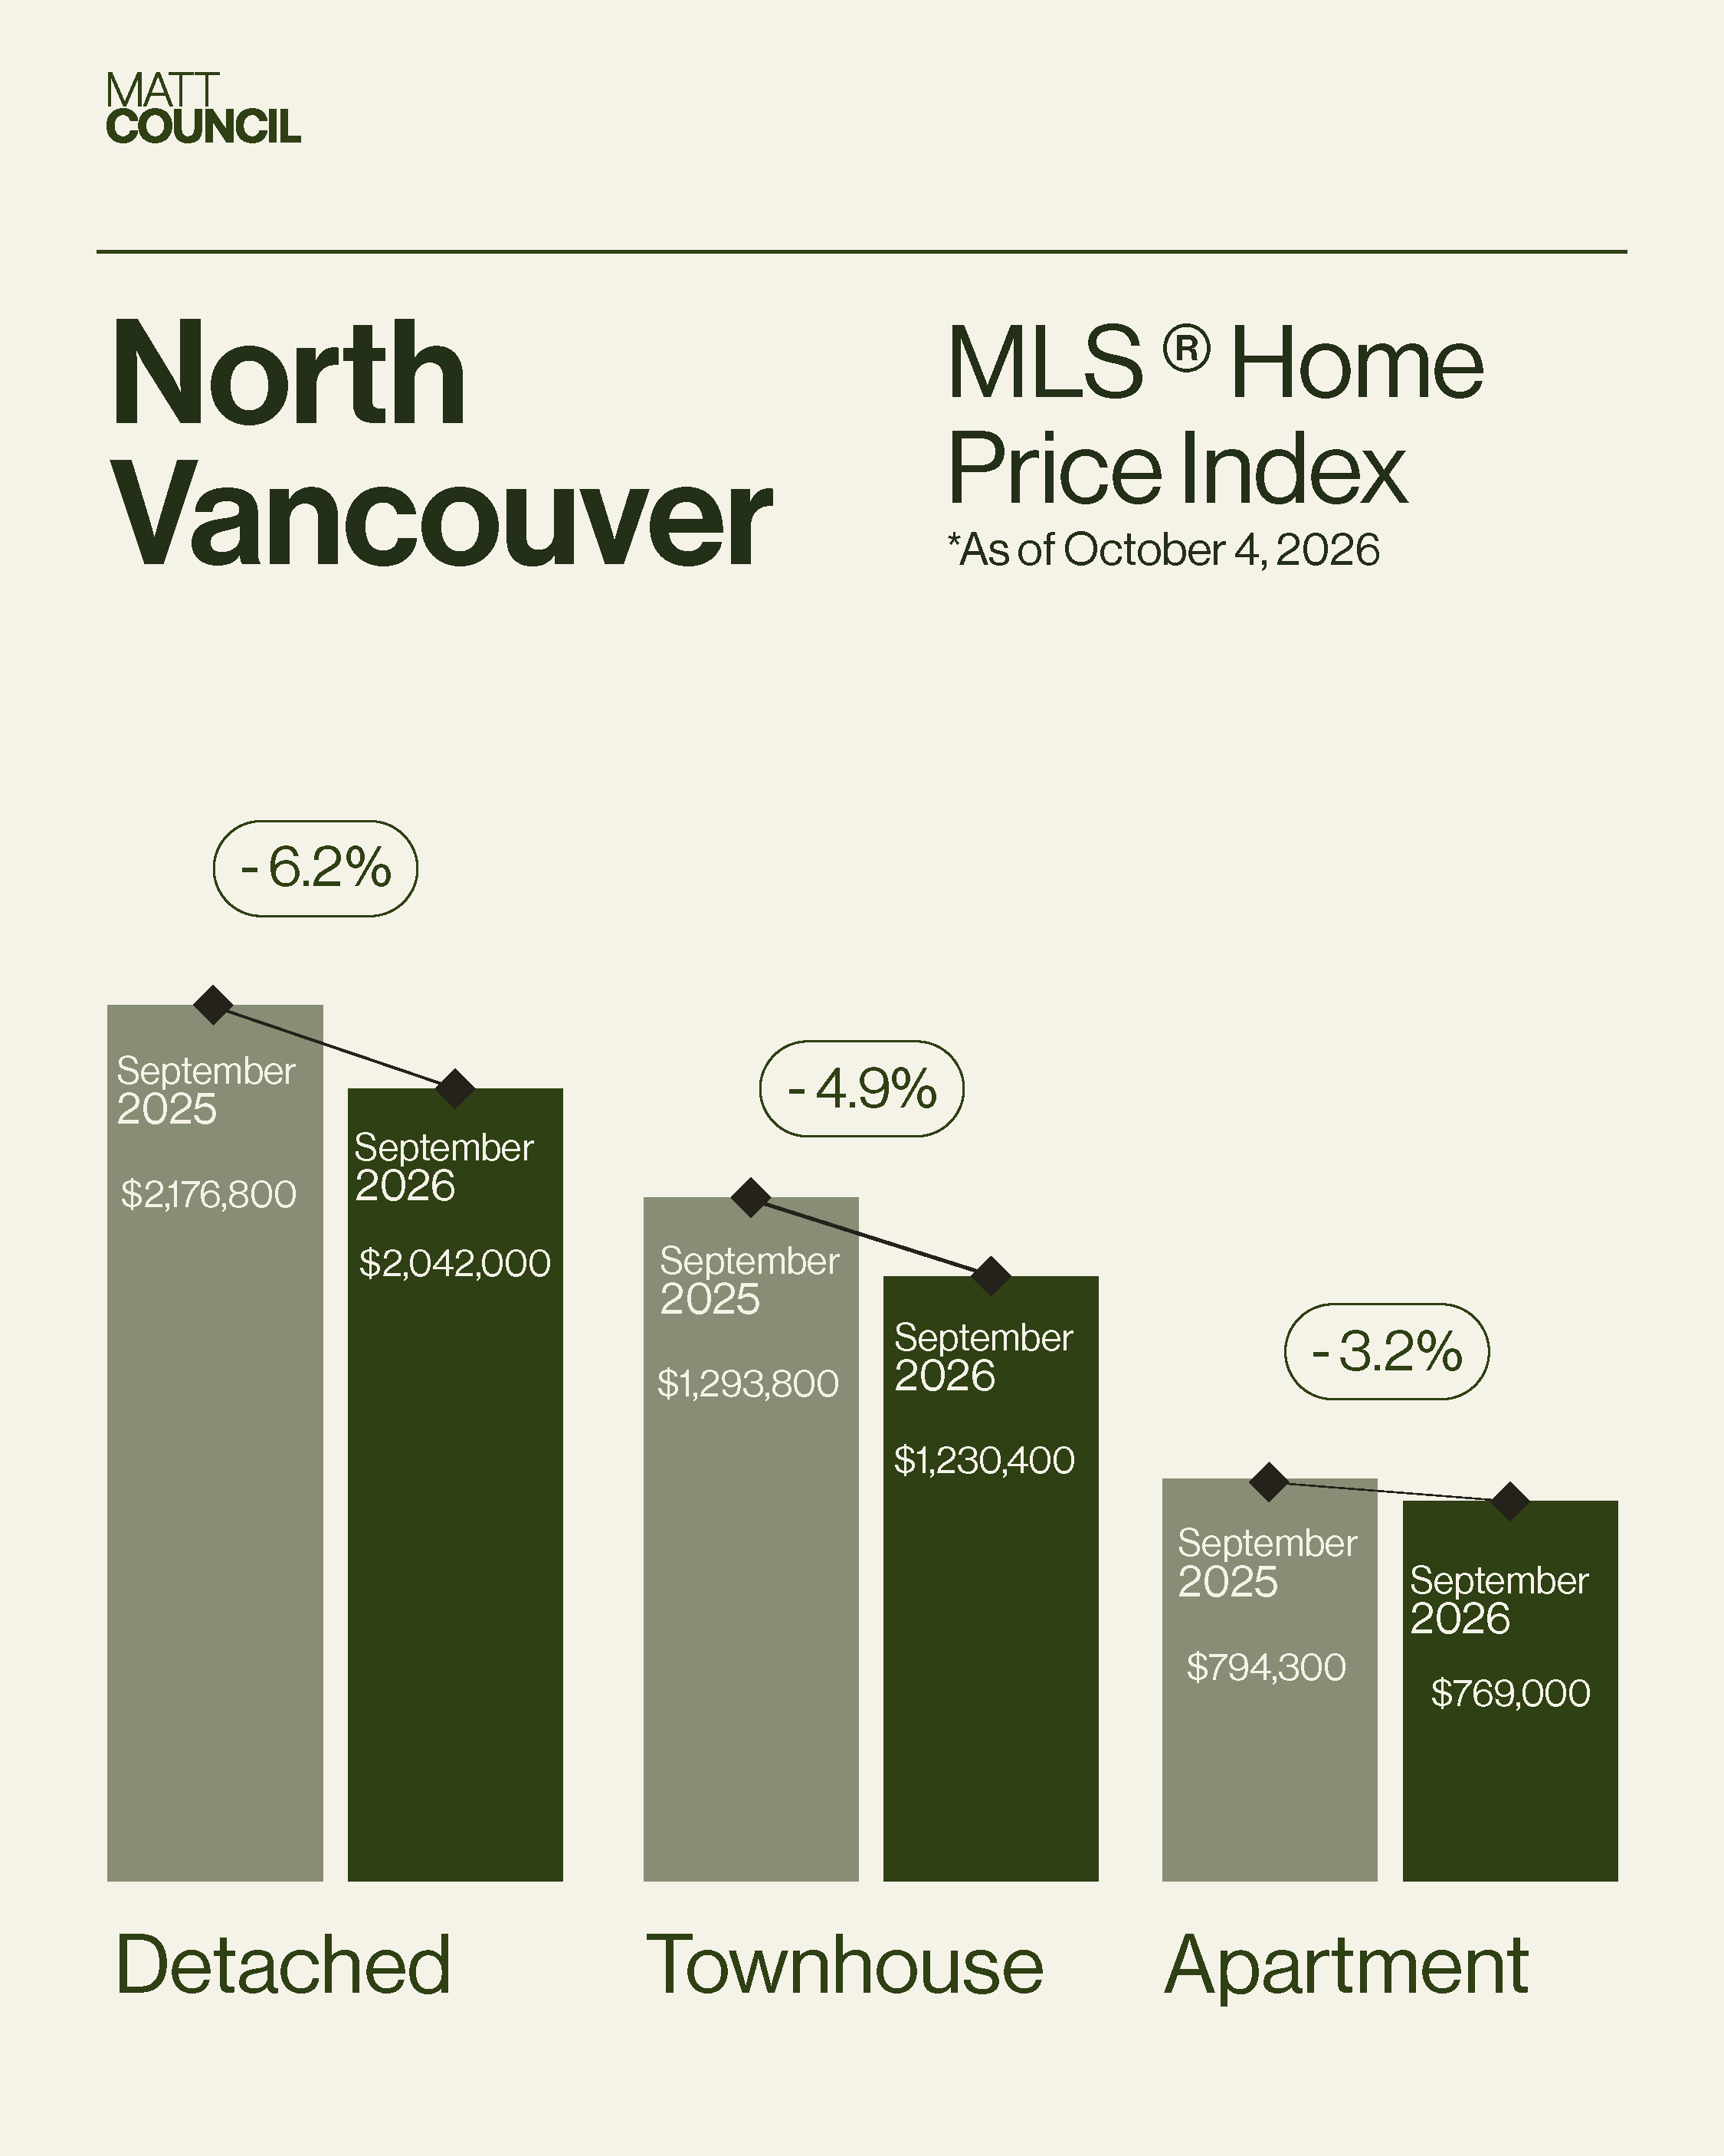
North Vancouver recorded 126 sales in September, down 20.3% from a year ago and 30.8% below the 10-year average for the month. New listings came in at 554, down 7.7% year over year, and total inventory fell 7.8% to 1,027 homes for sale. That is still 28.1% above the 10-year September average, so buyers continue to have plenty of choice. The sales-to-active ratio (the share of active listings that sold during the month) landed at 12.3%, down from 14.2% last year and at the low end of balanced territory. Homes sold for 96.0% of their original list price on average, down from 97.5%. Benchmark prices (the MLS® HPI, which tracks a typical home's value) eased across all three property types: houses fell 6.2% to $2,042,000, condos fell 3.2% to $769,000, and townhomes fell 4.9% to $1,230,400.
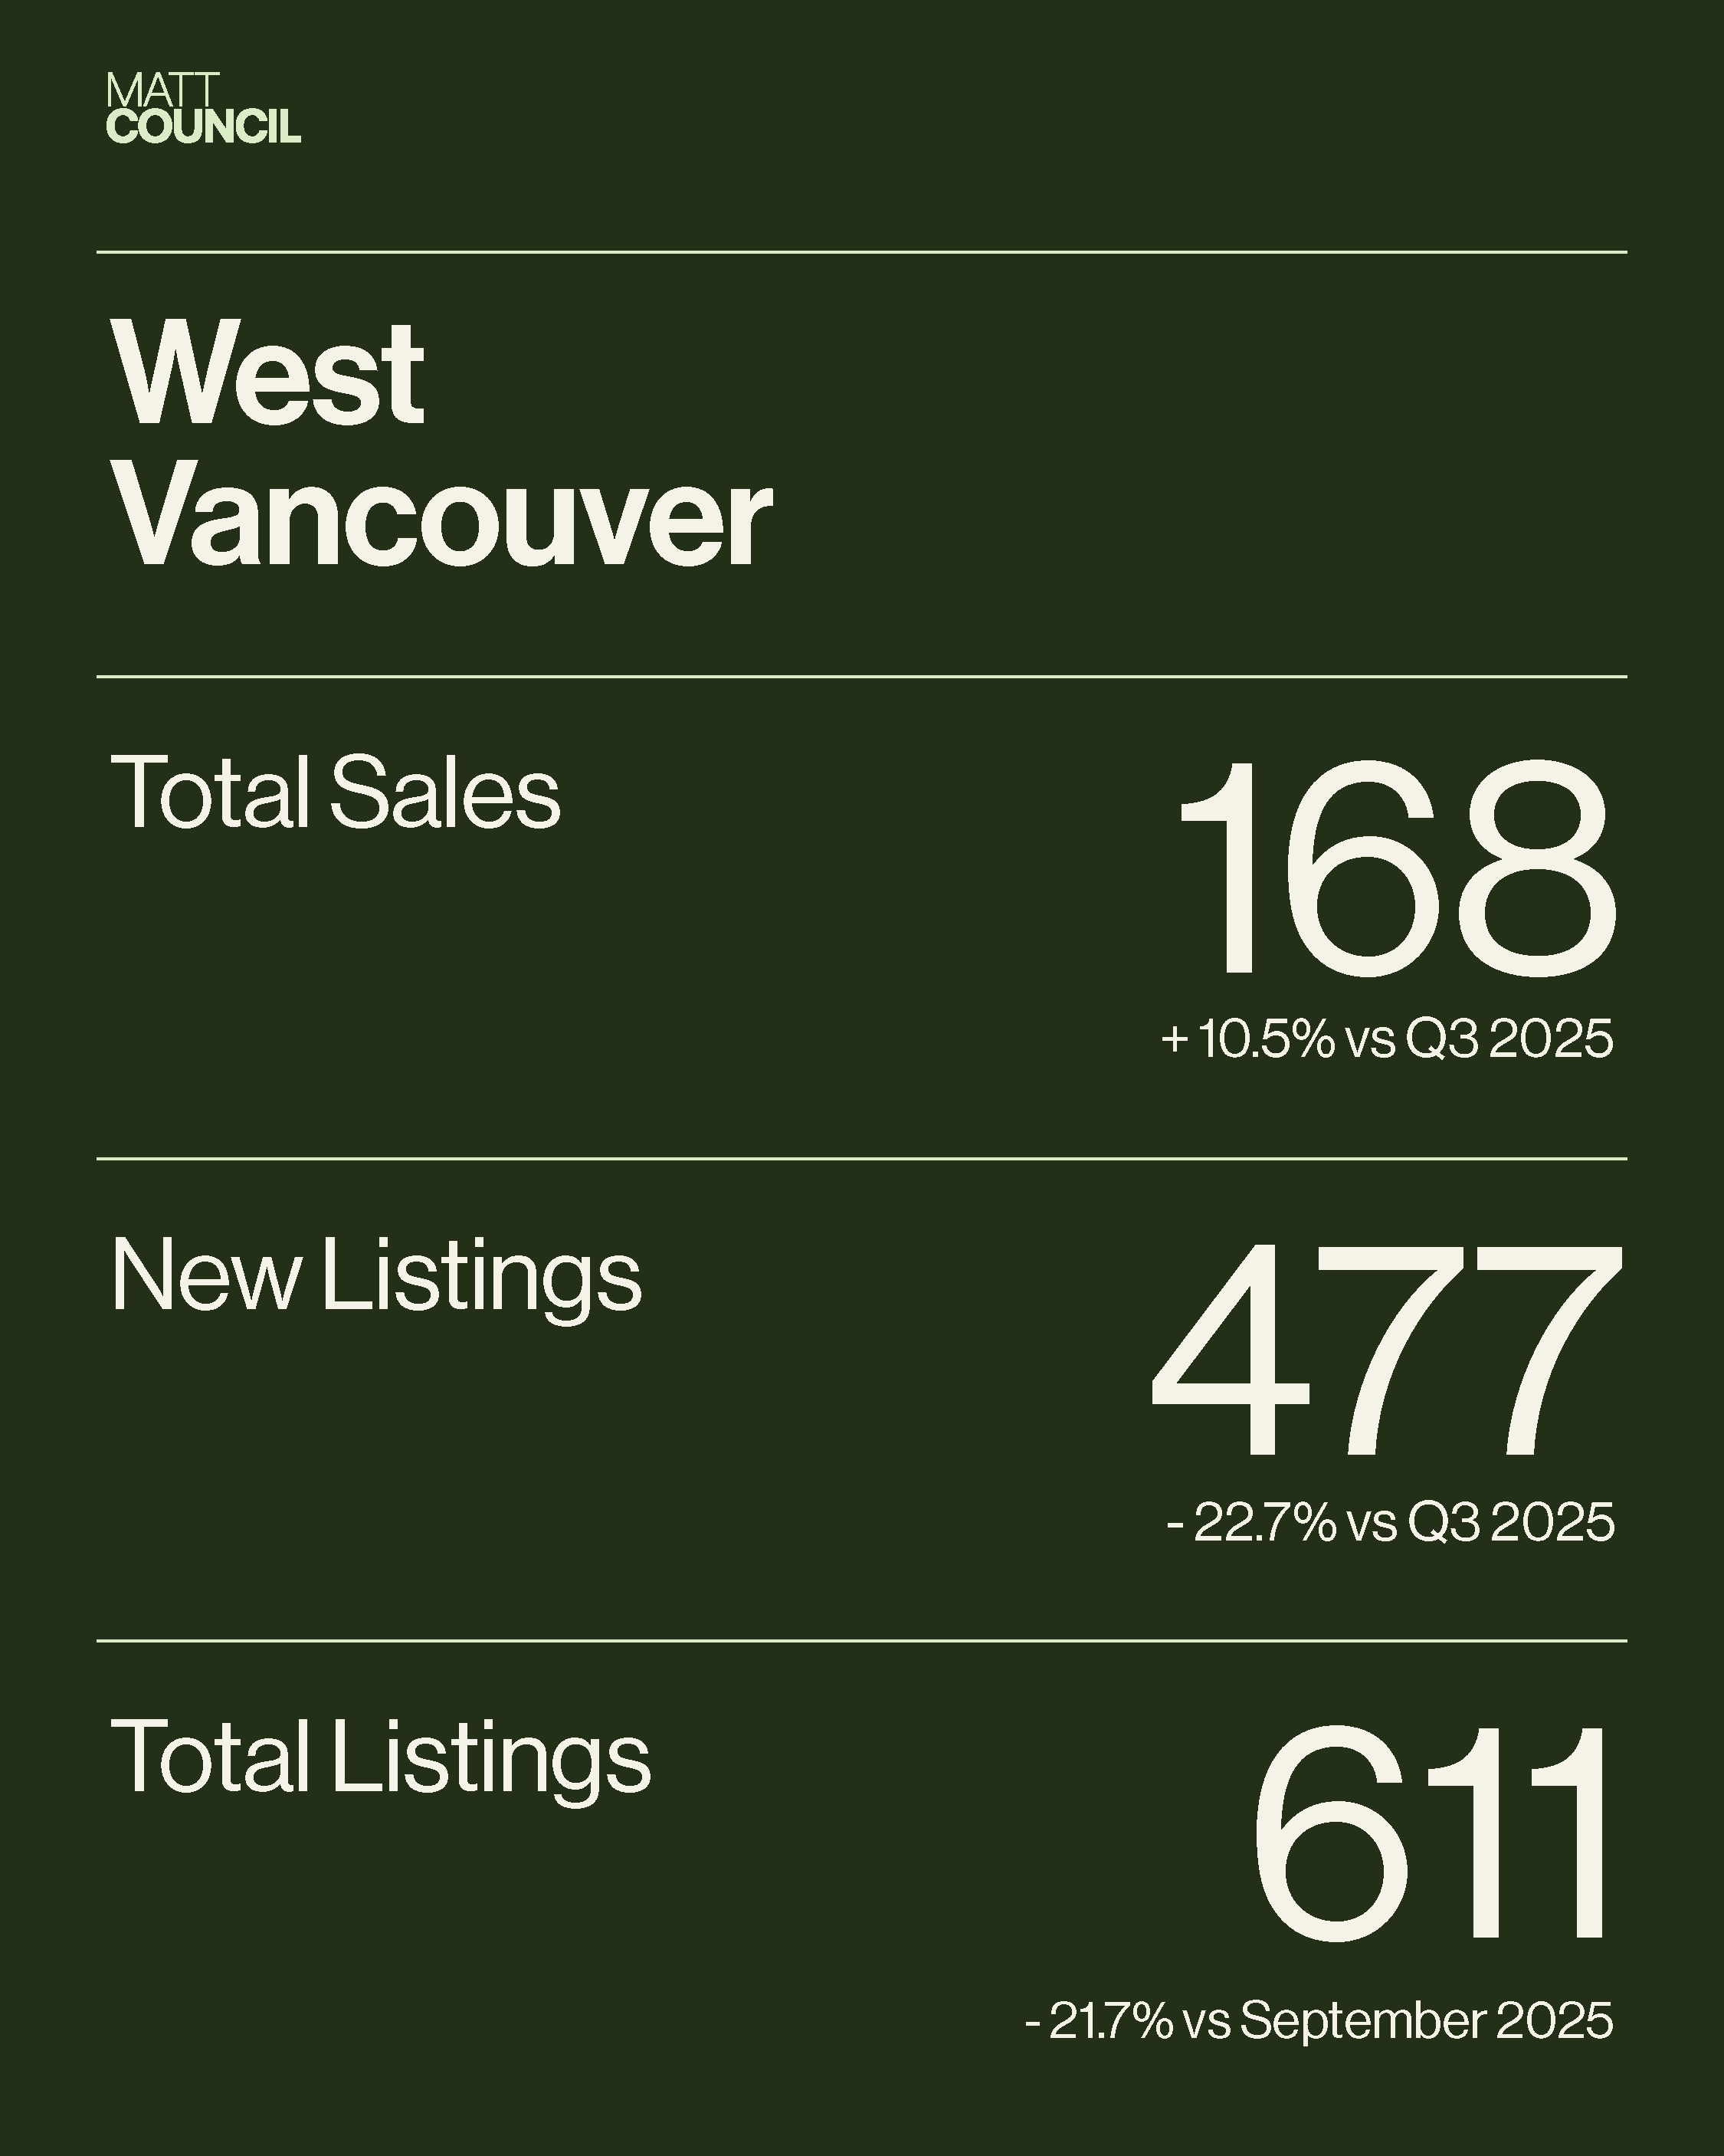
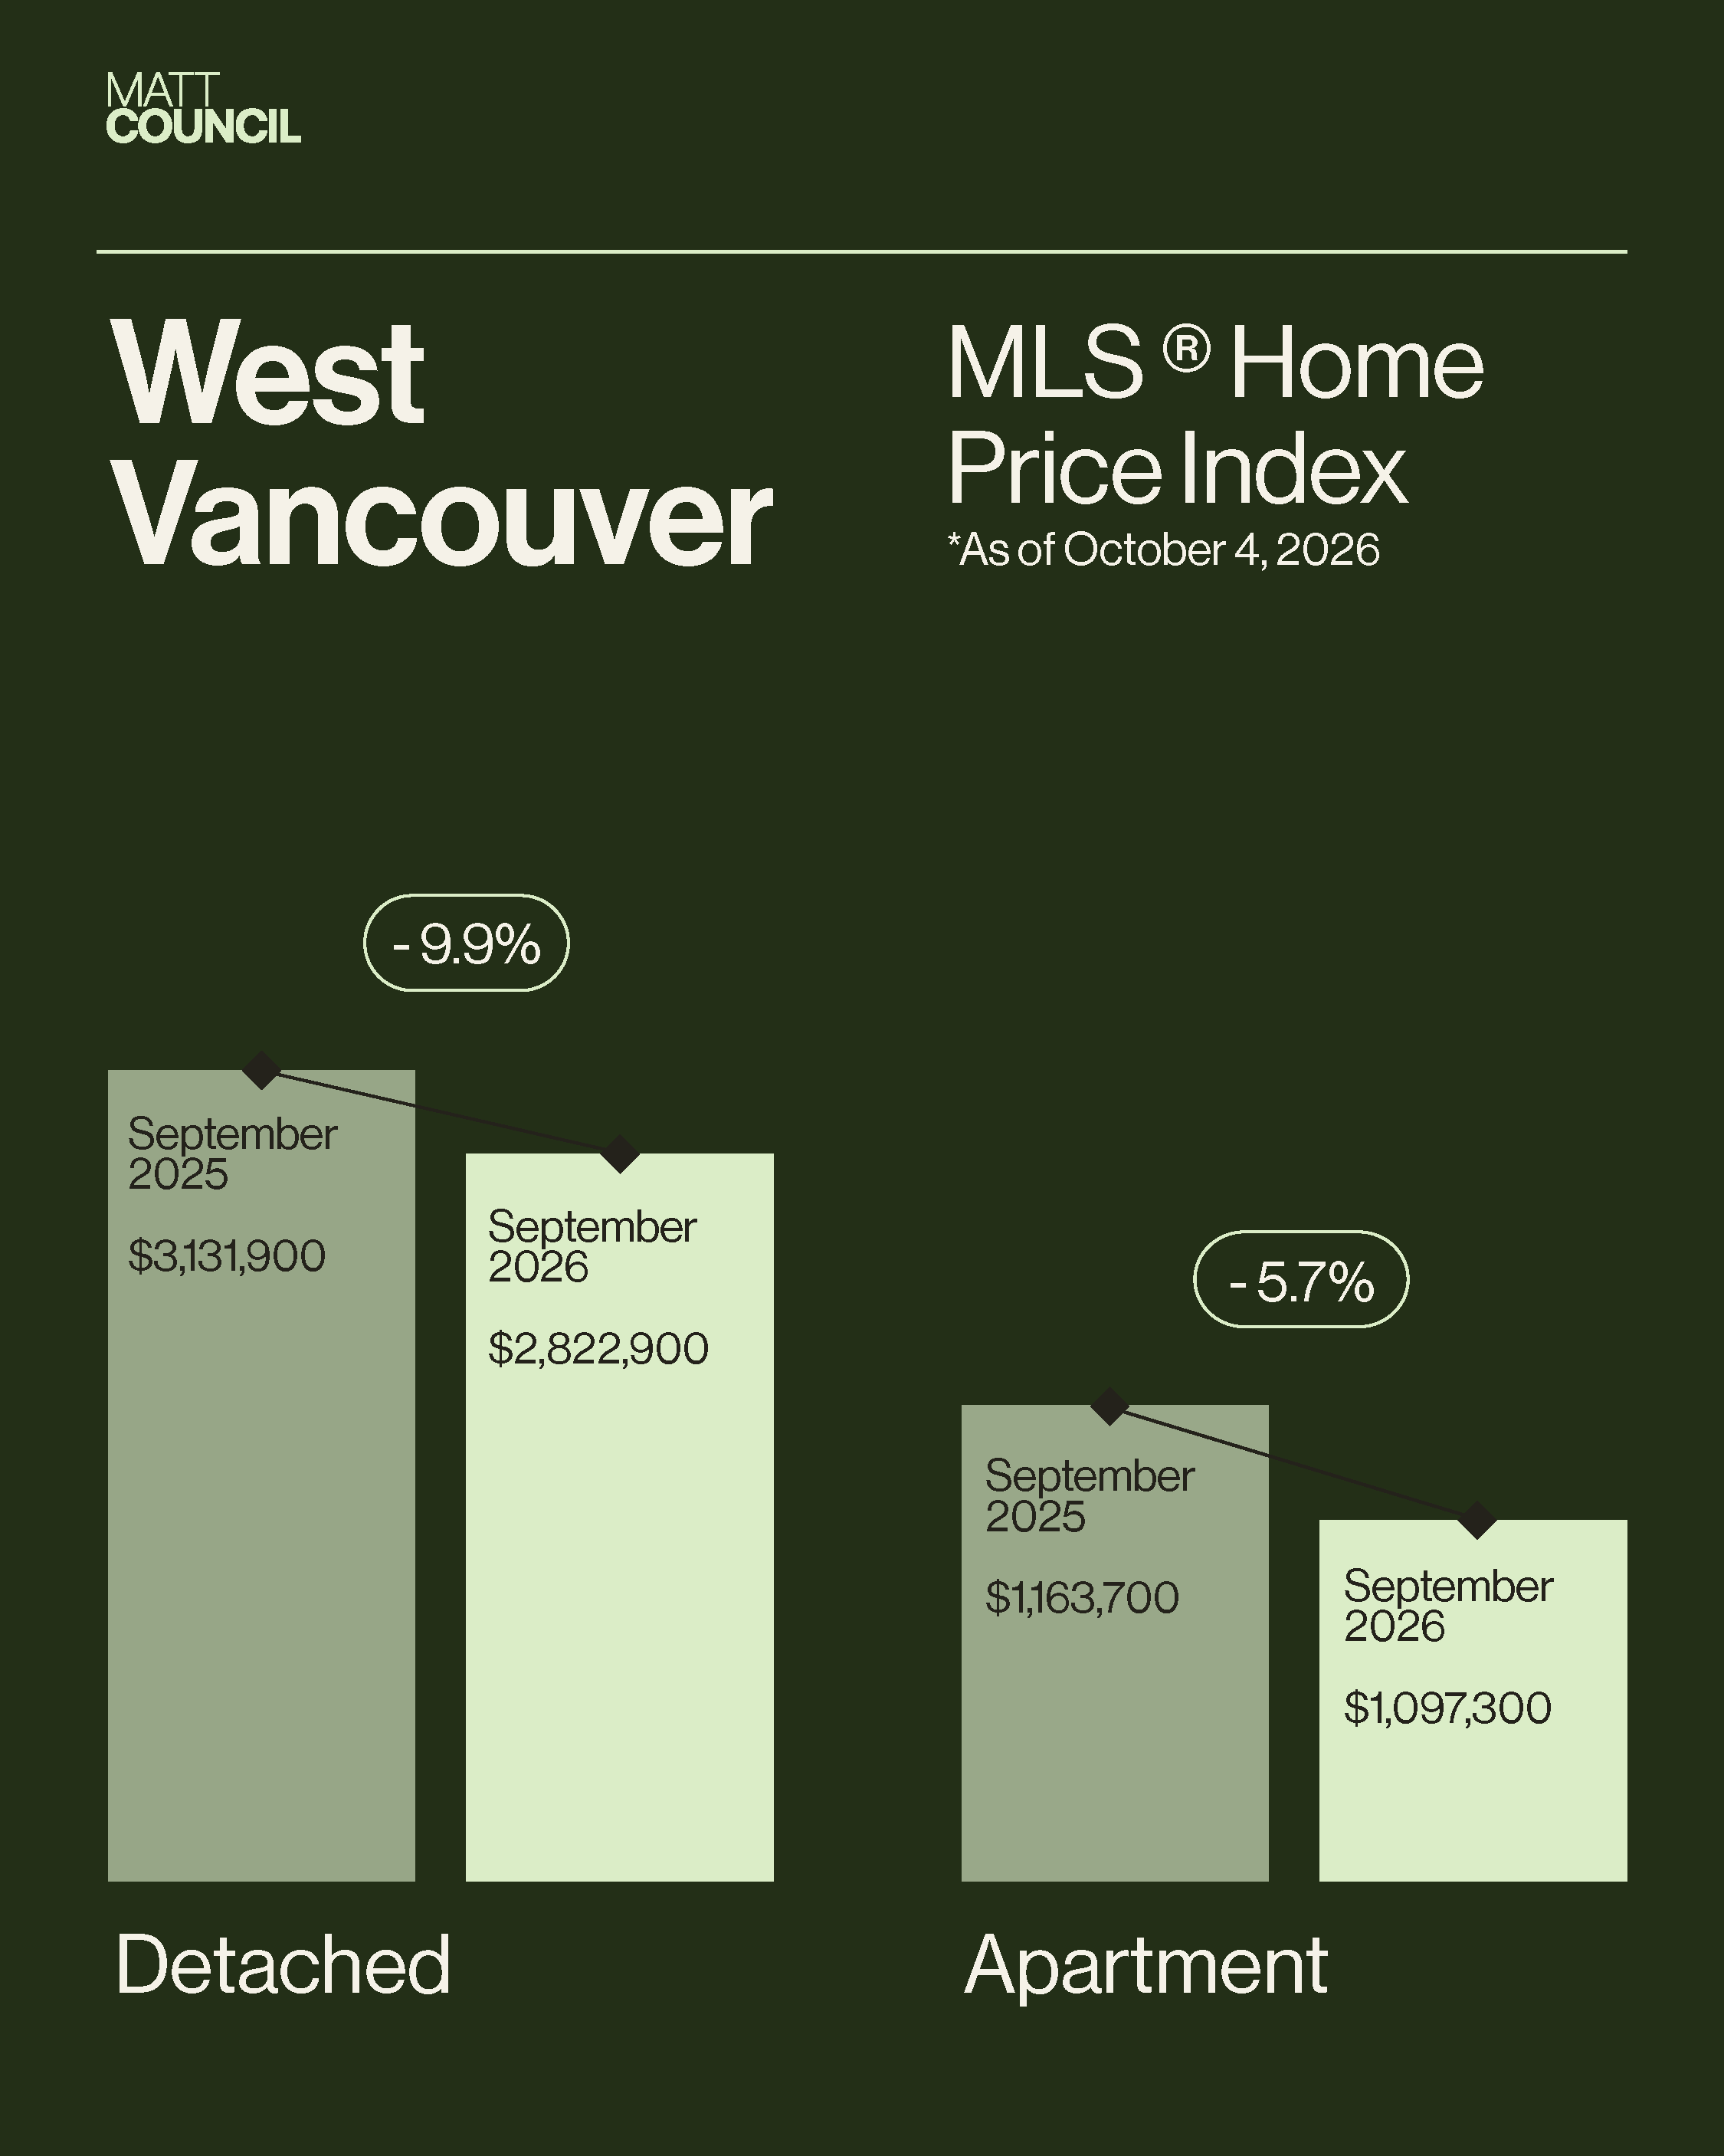
West Vancouver posted 60 sales, up 17.6% from last September (51 sales) and 11.1% above the 10-year average. That is a gain of nine sales, so it is worth keeping the small numbers in perspective. New listings dropped 36.4% to 175, and total inventory fell 21.7% to 611 homes for sale, though that is still 8.9% above the 10-year average. Stronger sales against a much smaller supply lifted the sales-to-active ratio to 9.8% from 6.5%, which still sits in buyer-favouring territory. Homes sold for 92.2% of their original list price, down from 93.3%, a sign sellers are still negotiating off asking. Benchmark prices softened further: houses fell 9.9% to $2,822,900 and condos fell 5.7% to $1,097,300. A reliable townhome benchmark wasn't available this month.
Detached Homes Hold Up Better Than Condos
Buyers remain selective, and how a home performs depends heavily on its pricing, its condition, and how broadly it appeals. Across the North Shore, detached homes have generally shown more resilience than strata properties, with condos the weakest segment. In North Vancouver, apartment sales were down 47.5% from last September, continuing a pattern that has run through the year. That may reflect changing sentiment toward condos, or it may simply mean pricing hasn't yet shifted enough to resonate with buyers.
The ratios by property type and price range show the same unevenness. In North Vancouver, detached homes sit at a 15.2% sales-to-active ratio, townhomes at 13.3%, and apartments at 8.6%. By price range, the $2M to $2.5M band is the strongest at 18.4%, while homes over $3M sit at just 5.9%. West Vancouver's picture is less clear-cut by property type, with apartments at 12.6%, townhomes at 12.5%, and detached homes at 8.9%. By price range, though, the pattern is sharp: the $2M to $3M band leads at 16.1%, while the $4M to $5M band is at only 1.6%. In both markets, demand is deepest in the middle to upper-middle price ranges and thinnest at the top.
September 2026 Stats
North Vancouver
| Metric | Sept 2026 | Sept 2025 | % Chg |
|---|---|---|---|
| Sales | 126 | 158 | ▼ 20.3% |
| New Listings | 554 | 600 | ▼ 7.7% |
| Active Inventory | 1,027 | 1,114 | ▼ 7.8% |
| Sales-to-Active Ratio | 12.3% (Balanced) | 14.2% | ▼ 13.4% |
| Sale Price / Original List Price | 96.0% | 97.5% | ▼ 1.5% |
| Days on Market | 23 | 18 | ▲ 27.8% |
| MLS® HPI Price Detached | $2,042,000 | $2,176,800 | ▼ 6.2% |
| MLS® HPI Price Condo | $769,000 | $794,300 | ▼ 3.2% |
| MLS® HPI Price Townhome | $1,230,400 | $1,293,800 | ▼ 4.9% |
Sales-to-Active Ratio by Property Type: Detached 15.2%, Apartments 8.6%, Townhomes 13.3%
| Price Range | Sales-to-Active Ratio |
|---|---|
| Under $750,000 | 11.0% |
| $750,000 to $1M | 8.4% |
| $1M to $1.5M | 12.6% |
| $1.5M to $2M | 16.4% |
| $2M to $2.5M | 18.4% |
| $2.5M to $3M | 12.3% |
| Over $3M | 5.9% |
West Vancouver
| Metric | Sept 2026 | Sept 2025 | % Chg |
|---|---|---|---|
| Sales | 60 | 51 | ▲ 17.6% |
| New Listings | 175 | 275 | ▼ 36.4% |
| Active Inventory | 611 | 780 | ▼ 21.7% |
| Sales-to-Active Ratio | 9.8% (Buyer Favouring) | 6.5% | ▲ 50.8% |
| Sale Price / Original List Price | 92.2% | 93.3% | ▼ 1.7% |
| Days on Market | 52 | 37 | ▲ 40.5% |
| MLS® HPI Price Detached | $2,822,900 | $3,131,900 | ▼ 9.9% |
| MLS® HPI Price Condo | $1,097,300 | $1,163,700 | ▼ 5.7% |
| MLS® HPI Price Townhome | n/a | n/a | -- |
Sales-to-Active Ratio by Property Type: Detached 8.9%, Apartments 12.6%, Townhomes 12.5%
| Price Range | Sales-to-Active Ratio |
|---|---|
| Under $1M | 11.1% |
| $1M to $2M | 13.3% |
| $2M to $3M | 16.1% |
| $3M to $4M | 7.4% |
| $4M to $5M | 1.6% |
| $5M to $6M | 9.5% |
| Over $6M | 2.9% |
Looking Ahead: Strategic Advice
Several factors could shape buyer and seller behaviour through the rest of the year. Fixed mortgage rates have been edging higher, which could add pressure on affordability, particularly if variable rates start to move up as well. The upcoming municipal and provincial elections add another layer of uncertainty, since housing affordability is a major issue at both levels of government and the policies that follow could influence market sentiment.
For Sellers: Demand is concentrated, so where your home sits matters. In North Vancouver, the $2M to $2.5M range is converting at 18.4%, while homes over $3M are at 5.9% and apartments overall are at 8.6%. In West Vancouver, the $2M to $3M range is at 16.1% but the $4M to $5M range is at 1.6%. I would price against recent sold comparables rather than where you hope the market goes, because with inventory still above the 10-year average in both markets, buyers have options and will compare.
For Buyers: North Vancouver's inventory sits 28.1% above the 10-year average and apartments are at an 8.6% ratio, which gives you room to negotiate and take your time on due diligence. West Vancouver supply is tightening (611 homes, down 21.7%), and the $2M to $3M range is more competitive at 16.1%, so be prepared to move decisively on a well-priced home there. With fixed rates edging up, I would also check your mortgage pre-approval and rate-hold terms before you start making offers.
Planning a move?
Every micro-neighbourhood and building on the North Shore is behaving differently right now. Whether you want to navigate current choices or need an accurate strategy to sell, I am here to help you translate the data.
Call/text or email me to book a 15-minute strategy session.
604-317-4464
Matt@RossettiRealty.ca

About Matt Council
Matt Council is a North Vancouver Realtor and West Van specialist with a background in finance, focused on a data-driven, pressure-free approach to buying and selling on the North Shore.