
Market Update | September 2026
A review of market trends and statistics for August 2026.
North Shore Market Update: A Summer Without a Clear Direction
August kept up a pattern that has defined the North Shore all summer: activity that moves noticeably from one month to the next without settling into a trend. North Vancouver sales barely budged from a year ago, while West Vancouver posted a sharp jump, one that came right on the heels of a weak July. At the same time, the number of homes available to buy kept shrinking across both markets, though that alone isn't proof the balance between buyers and sellers is shifting in sellers' favour.
At a Glance
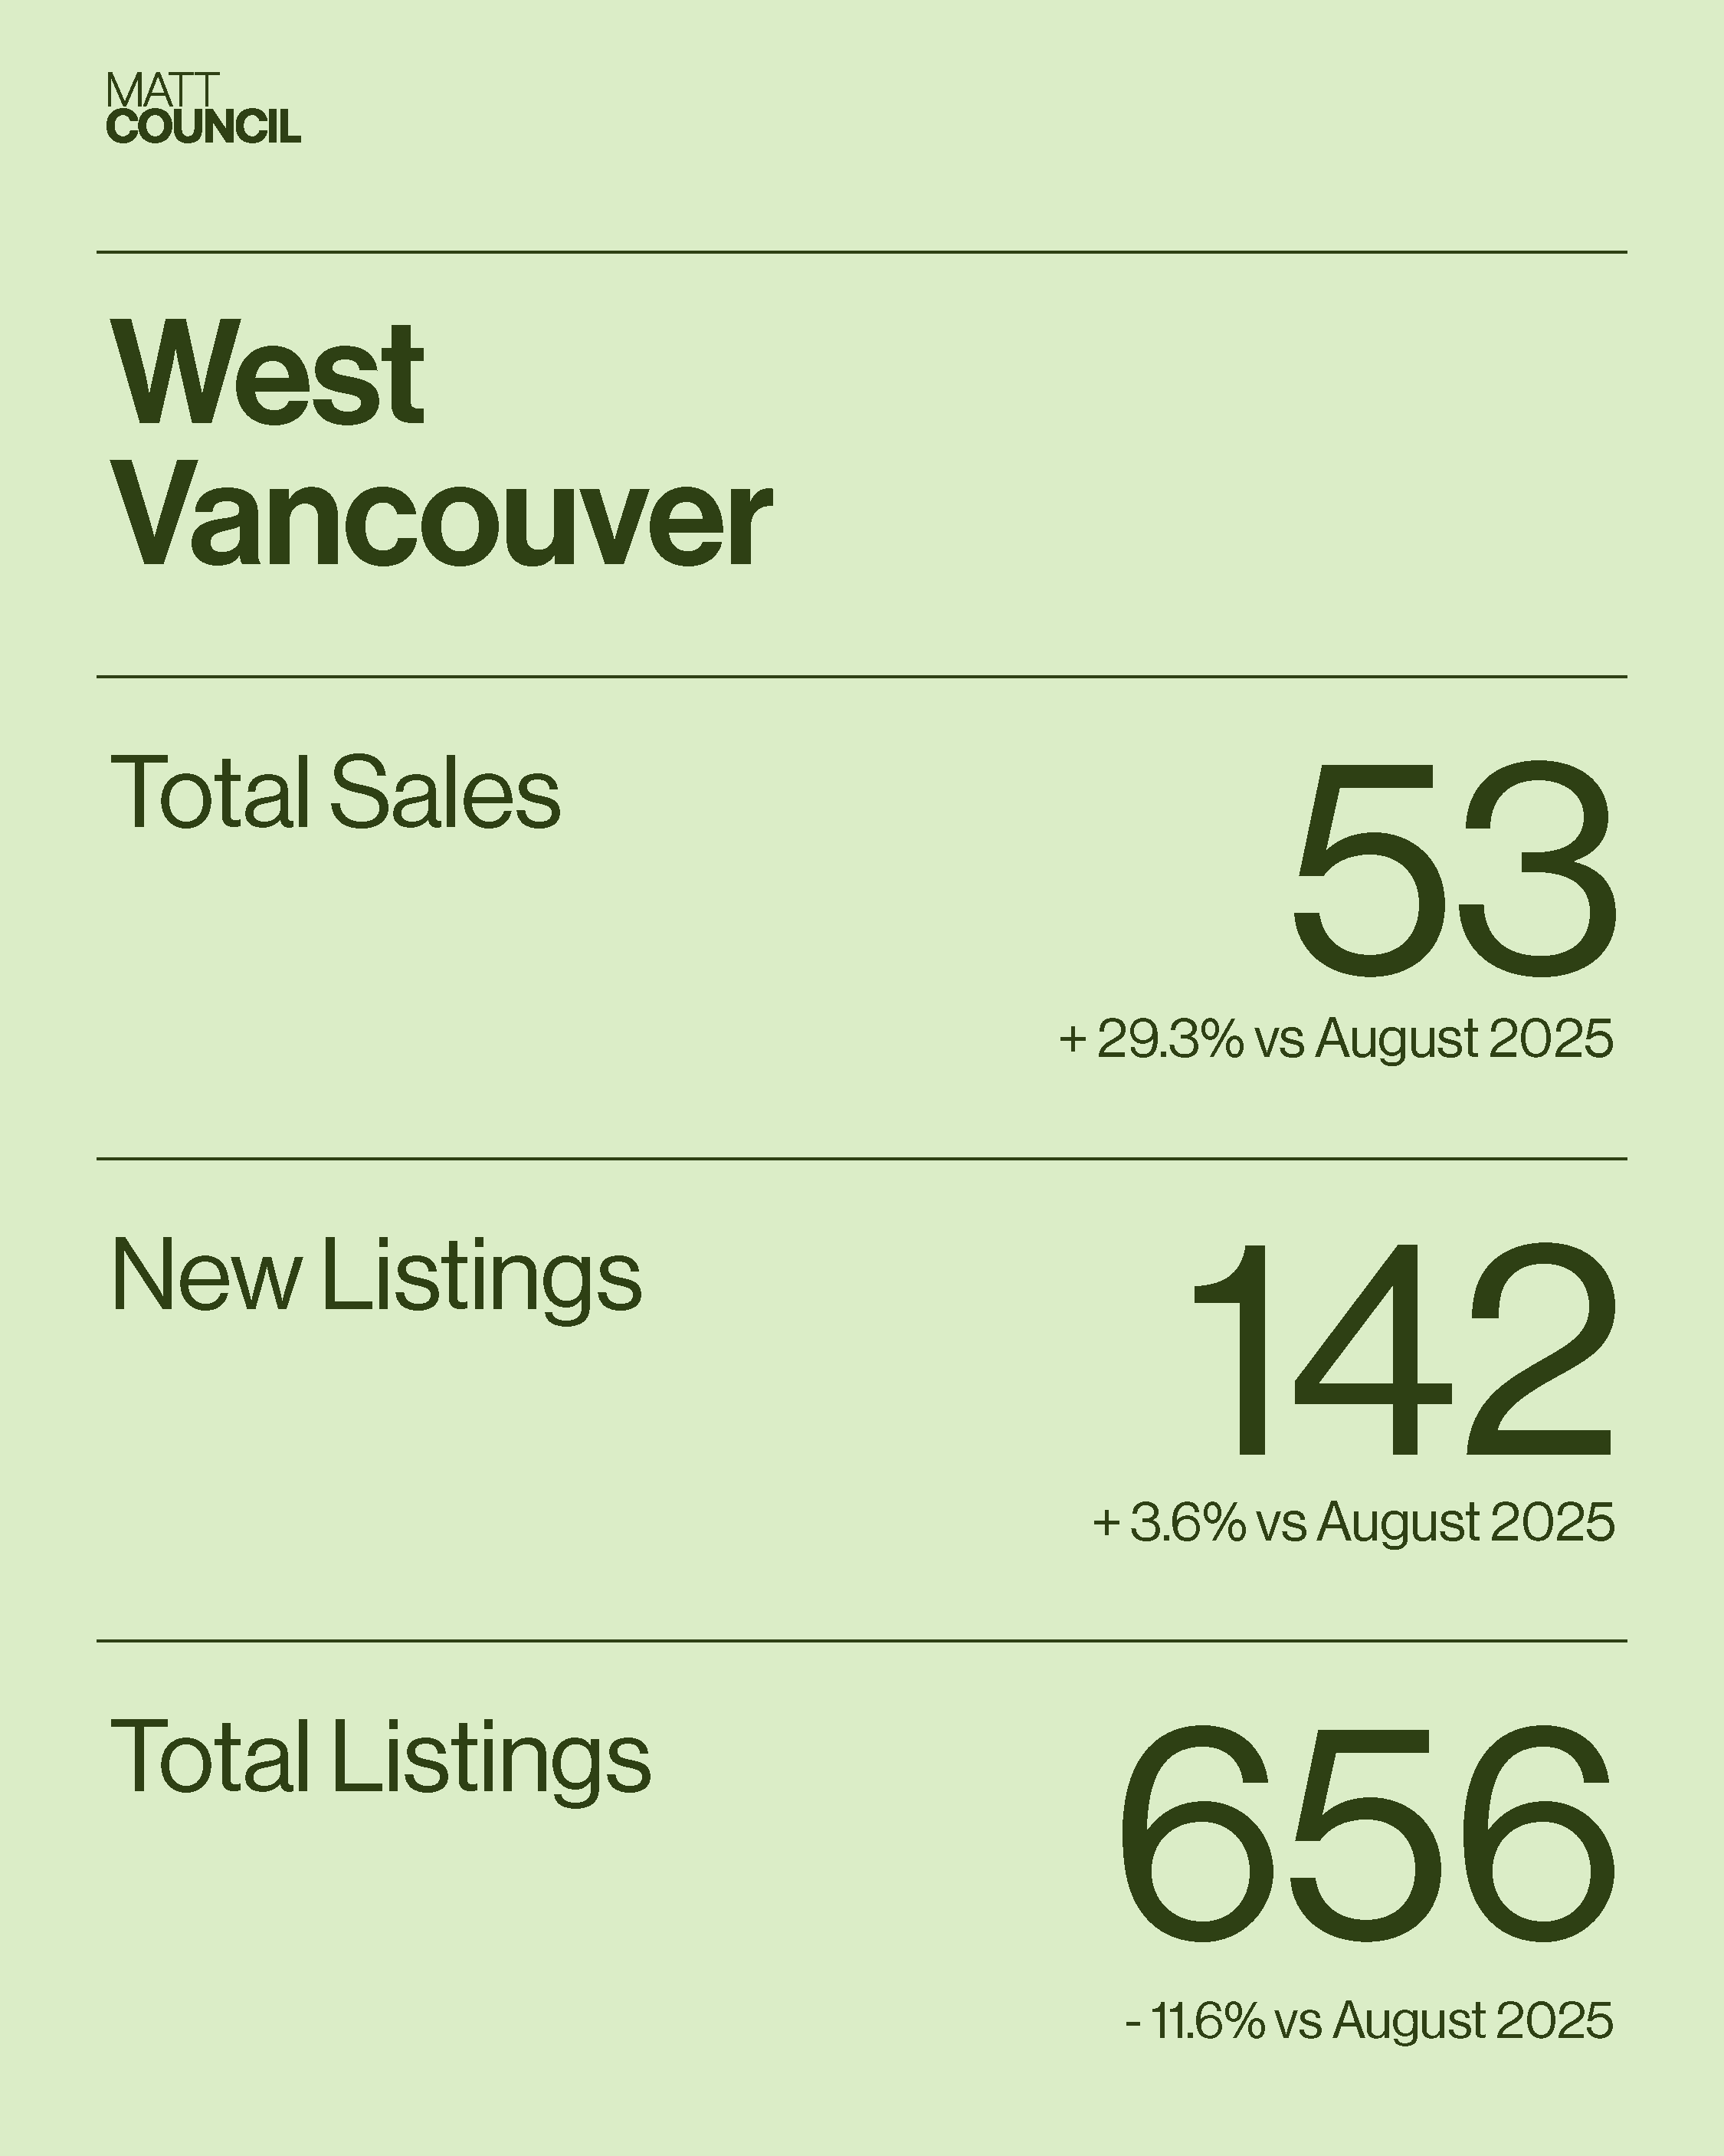
- West Van's swing: Sales jumped 29.3% year over year to 53, but that follows a notable July decline, a reminder that one strong month doesn't establish a new direction.
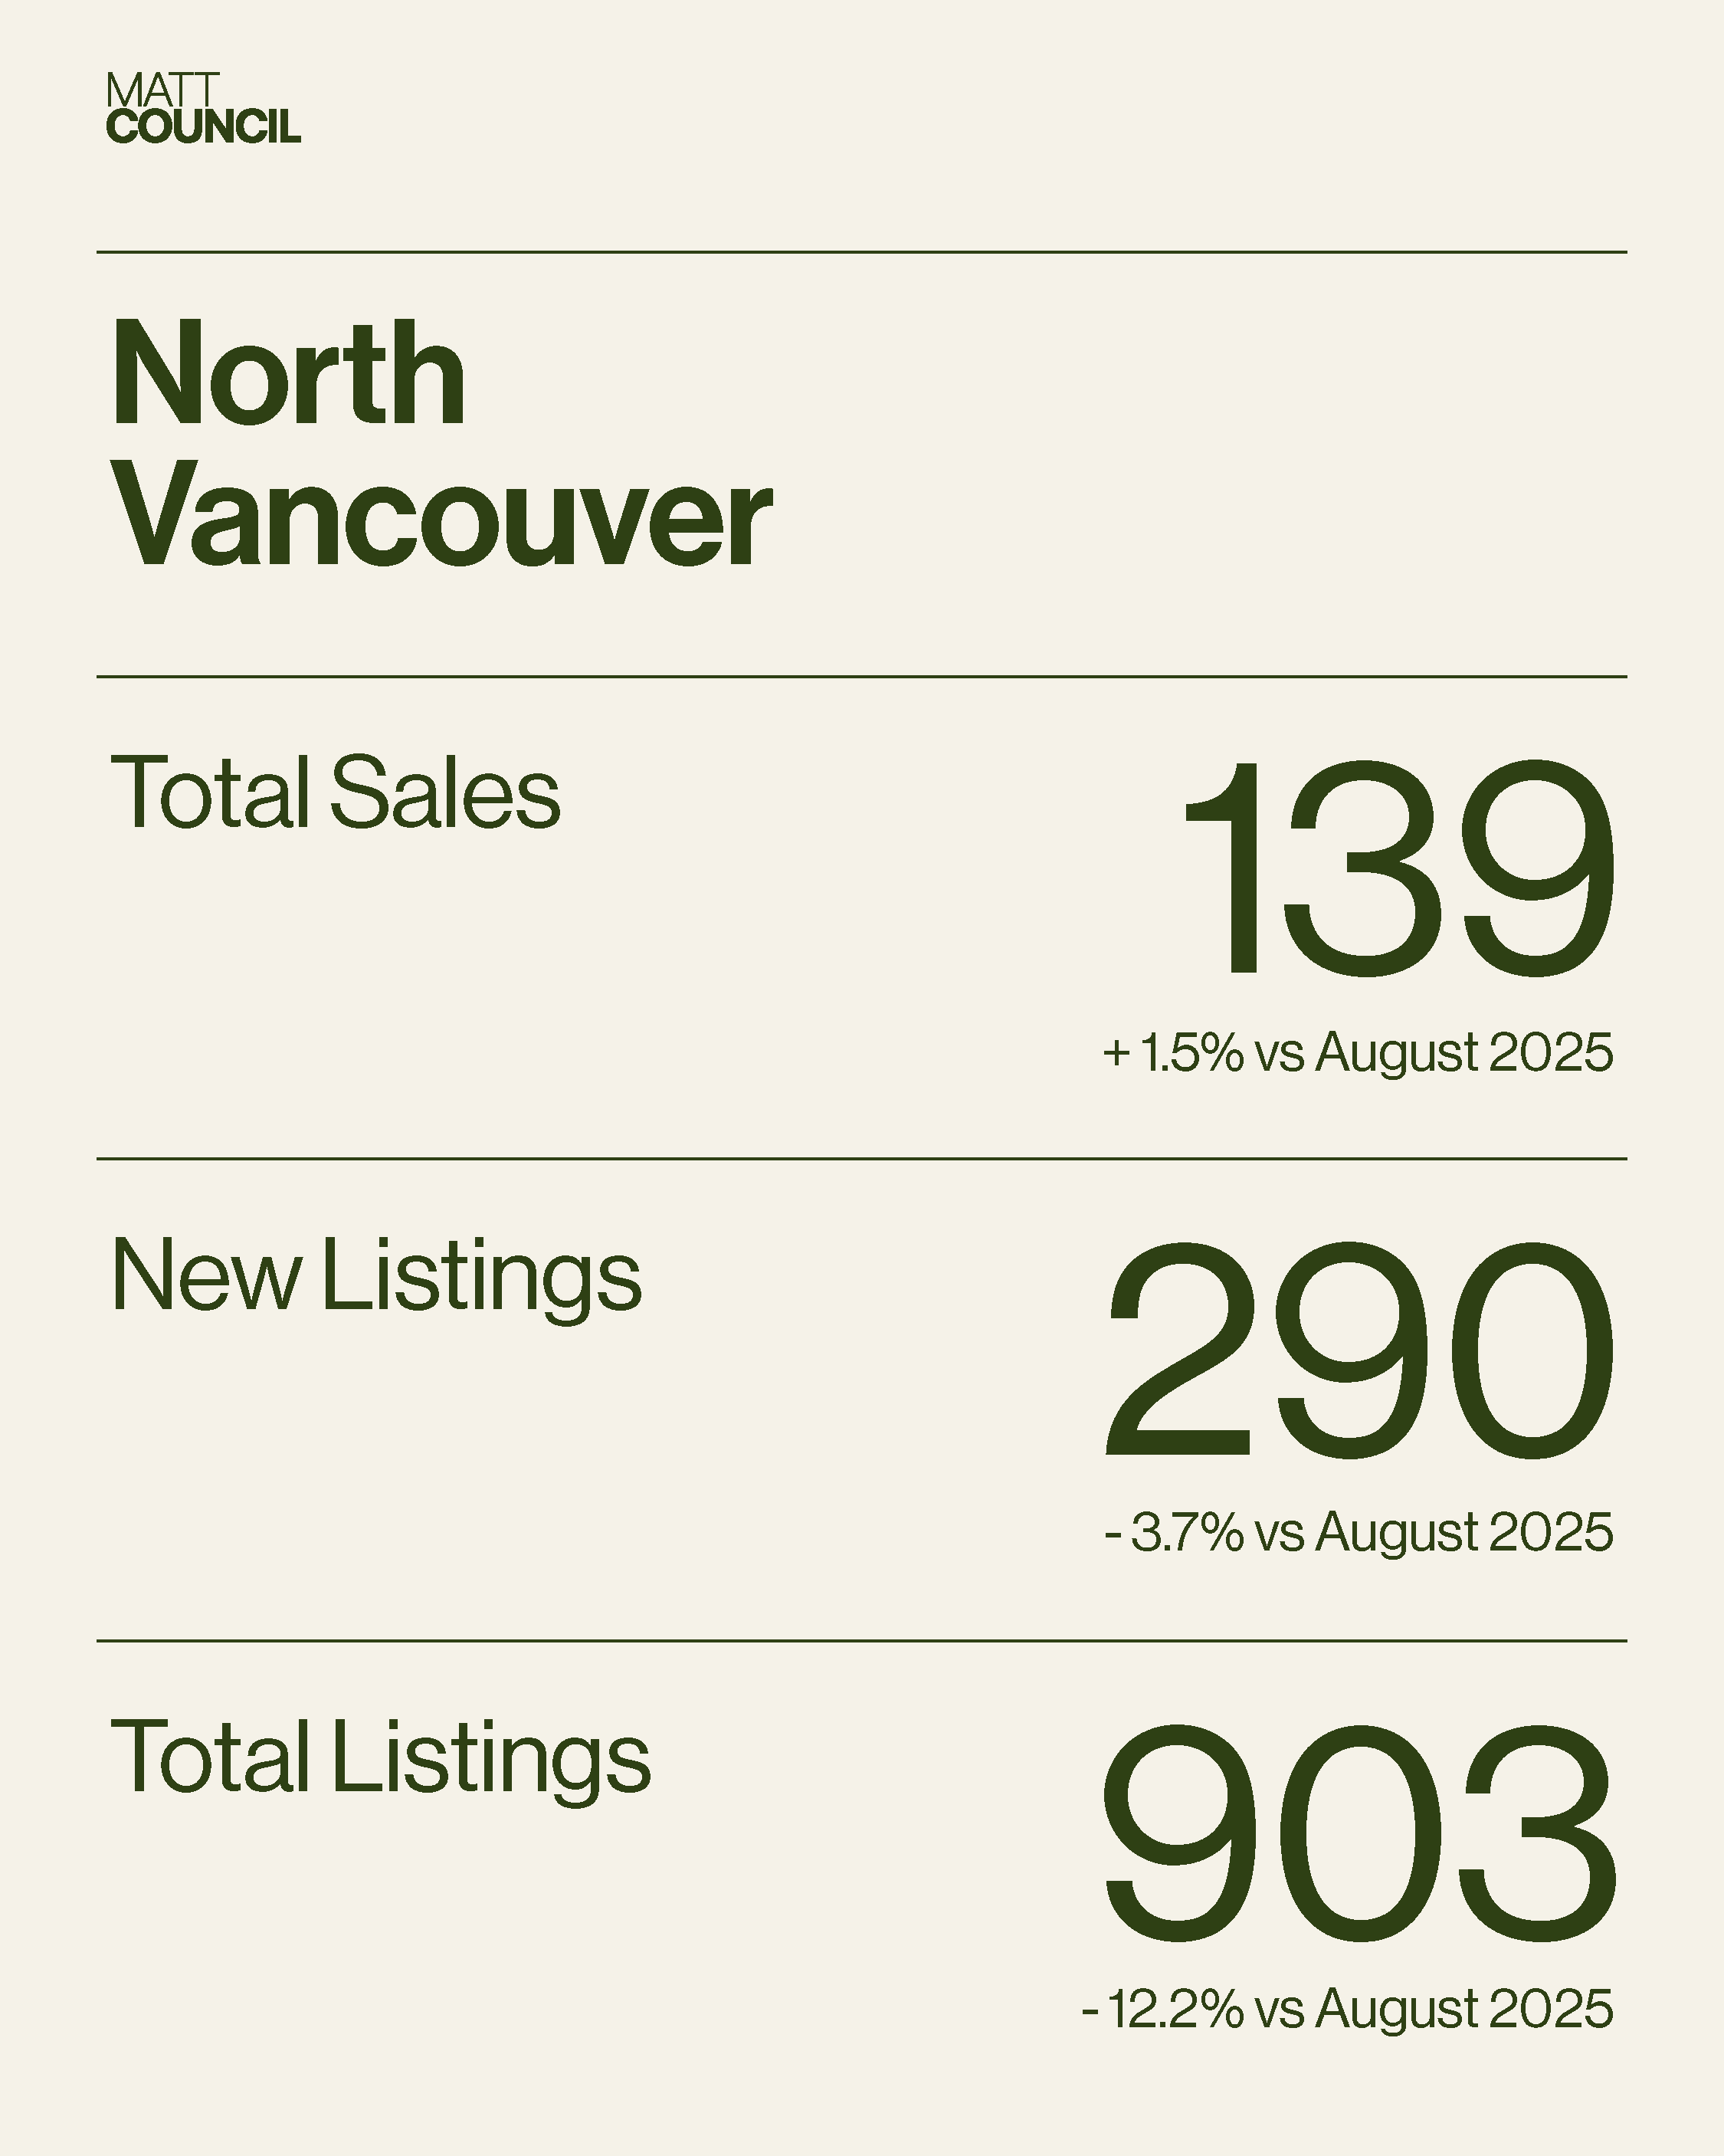
- North Van holds flat: Sales landed at 139, up just 1.5% from last August, essentially unchanged.
- Inventory keeps shrinking: Total listings fell 12.2% in North Vancouver and 11.6% in West Vancouver, but softer summer listing activity, not stronger demand, is likely the bigger driver.
- Days on market diverge: North Vancouver homes are taking longer to sell (28 days, up 47.4%), while West Vancouver homes are moving faster than a year ago (38 days, down 29.6%).
Divergent Paths, Same Underlying Caution
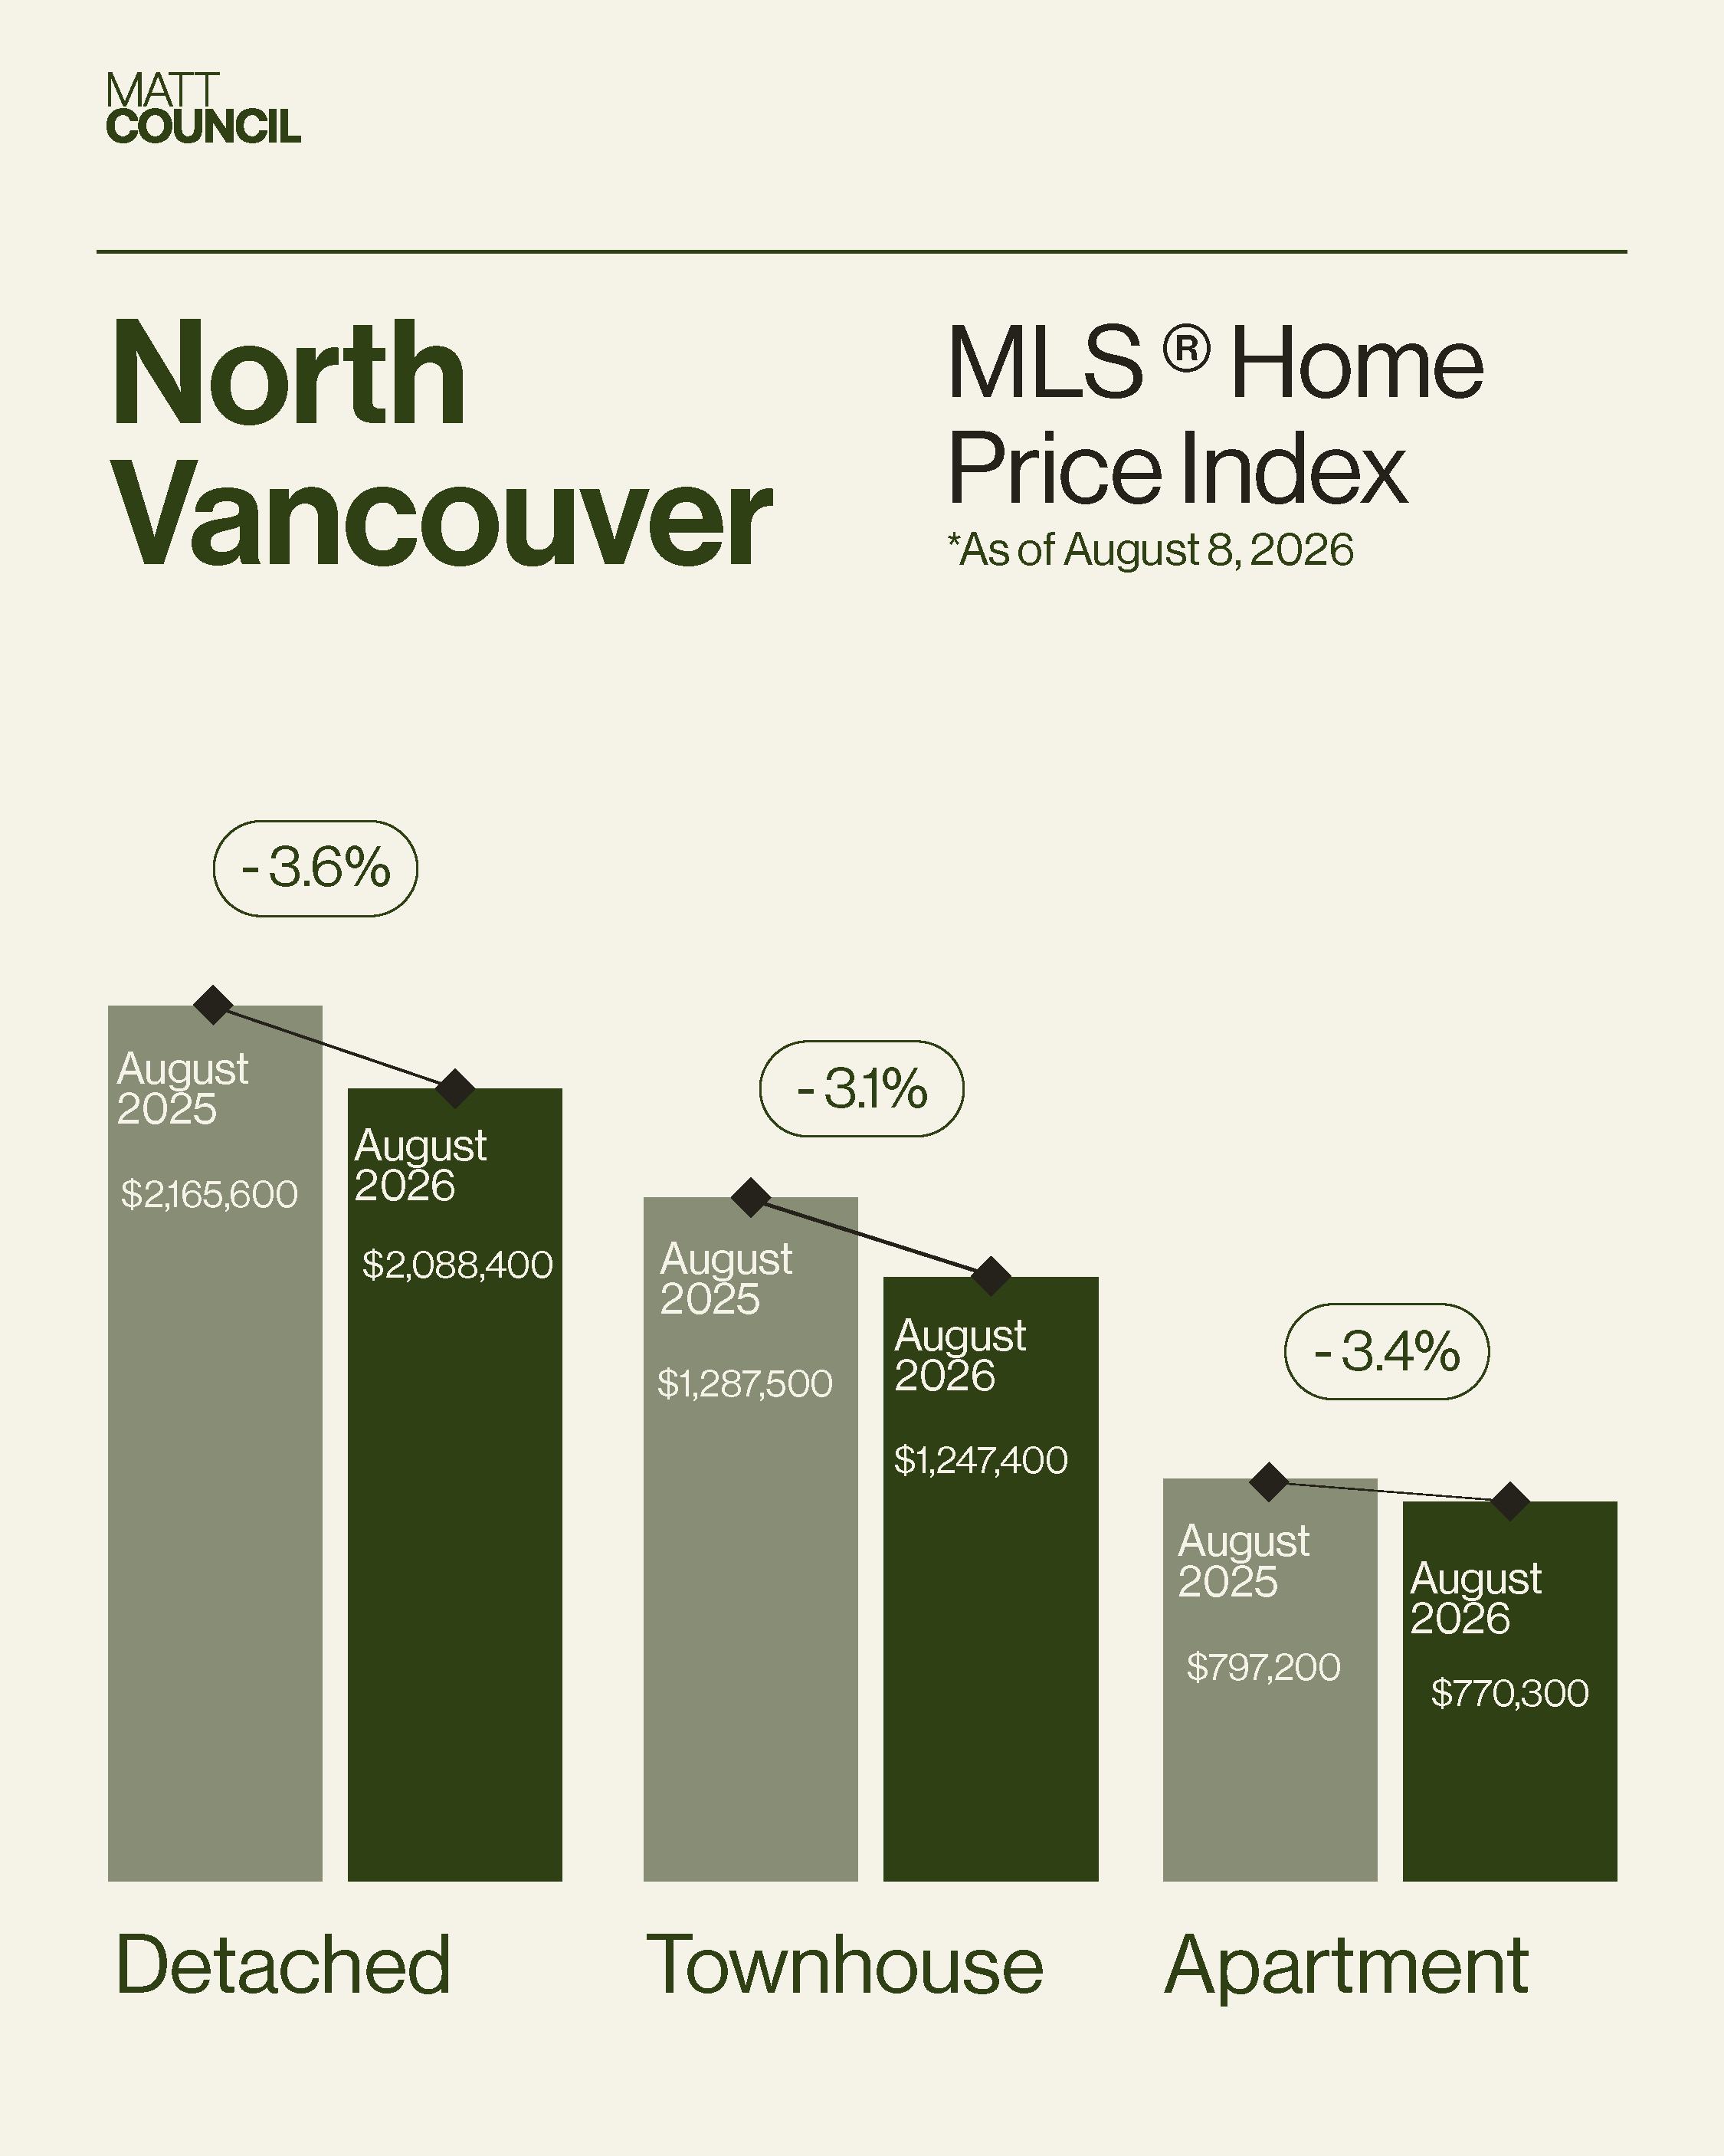
North Vancouver sales came in essentially flat, 139 this August against 137 last year, a 1.5% increase that doesn't point to any real shift in momentum. New listings dropped 3.7% and total inventory fell 12.2% to 903 active listings, pulling the sales-to-active ratio up to 15.4% from 13%, which still sits in balanced territory. Homes are taking meaningfully longer to sell, though: 28 days on market versus 19 a year ago, a 47.4% increase. Sellers are still getting close to their asking price, with the sale-to-original-list-price ratio at 96.5%, essentially flat from 96.2%. Pricing continued to soften across the board: benchmark house prices fell 3.6% to $2,088,400, condos fell 3.4% to $770,300, and townhomes slipped to $1,247,400, down roughly 3.1% from a year ago.
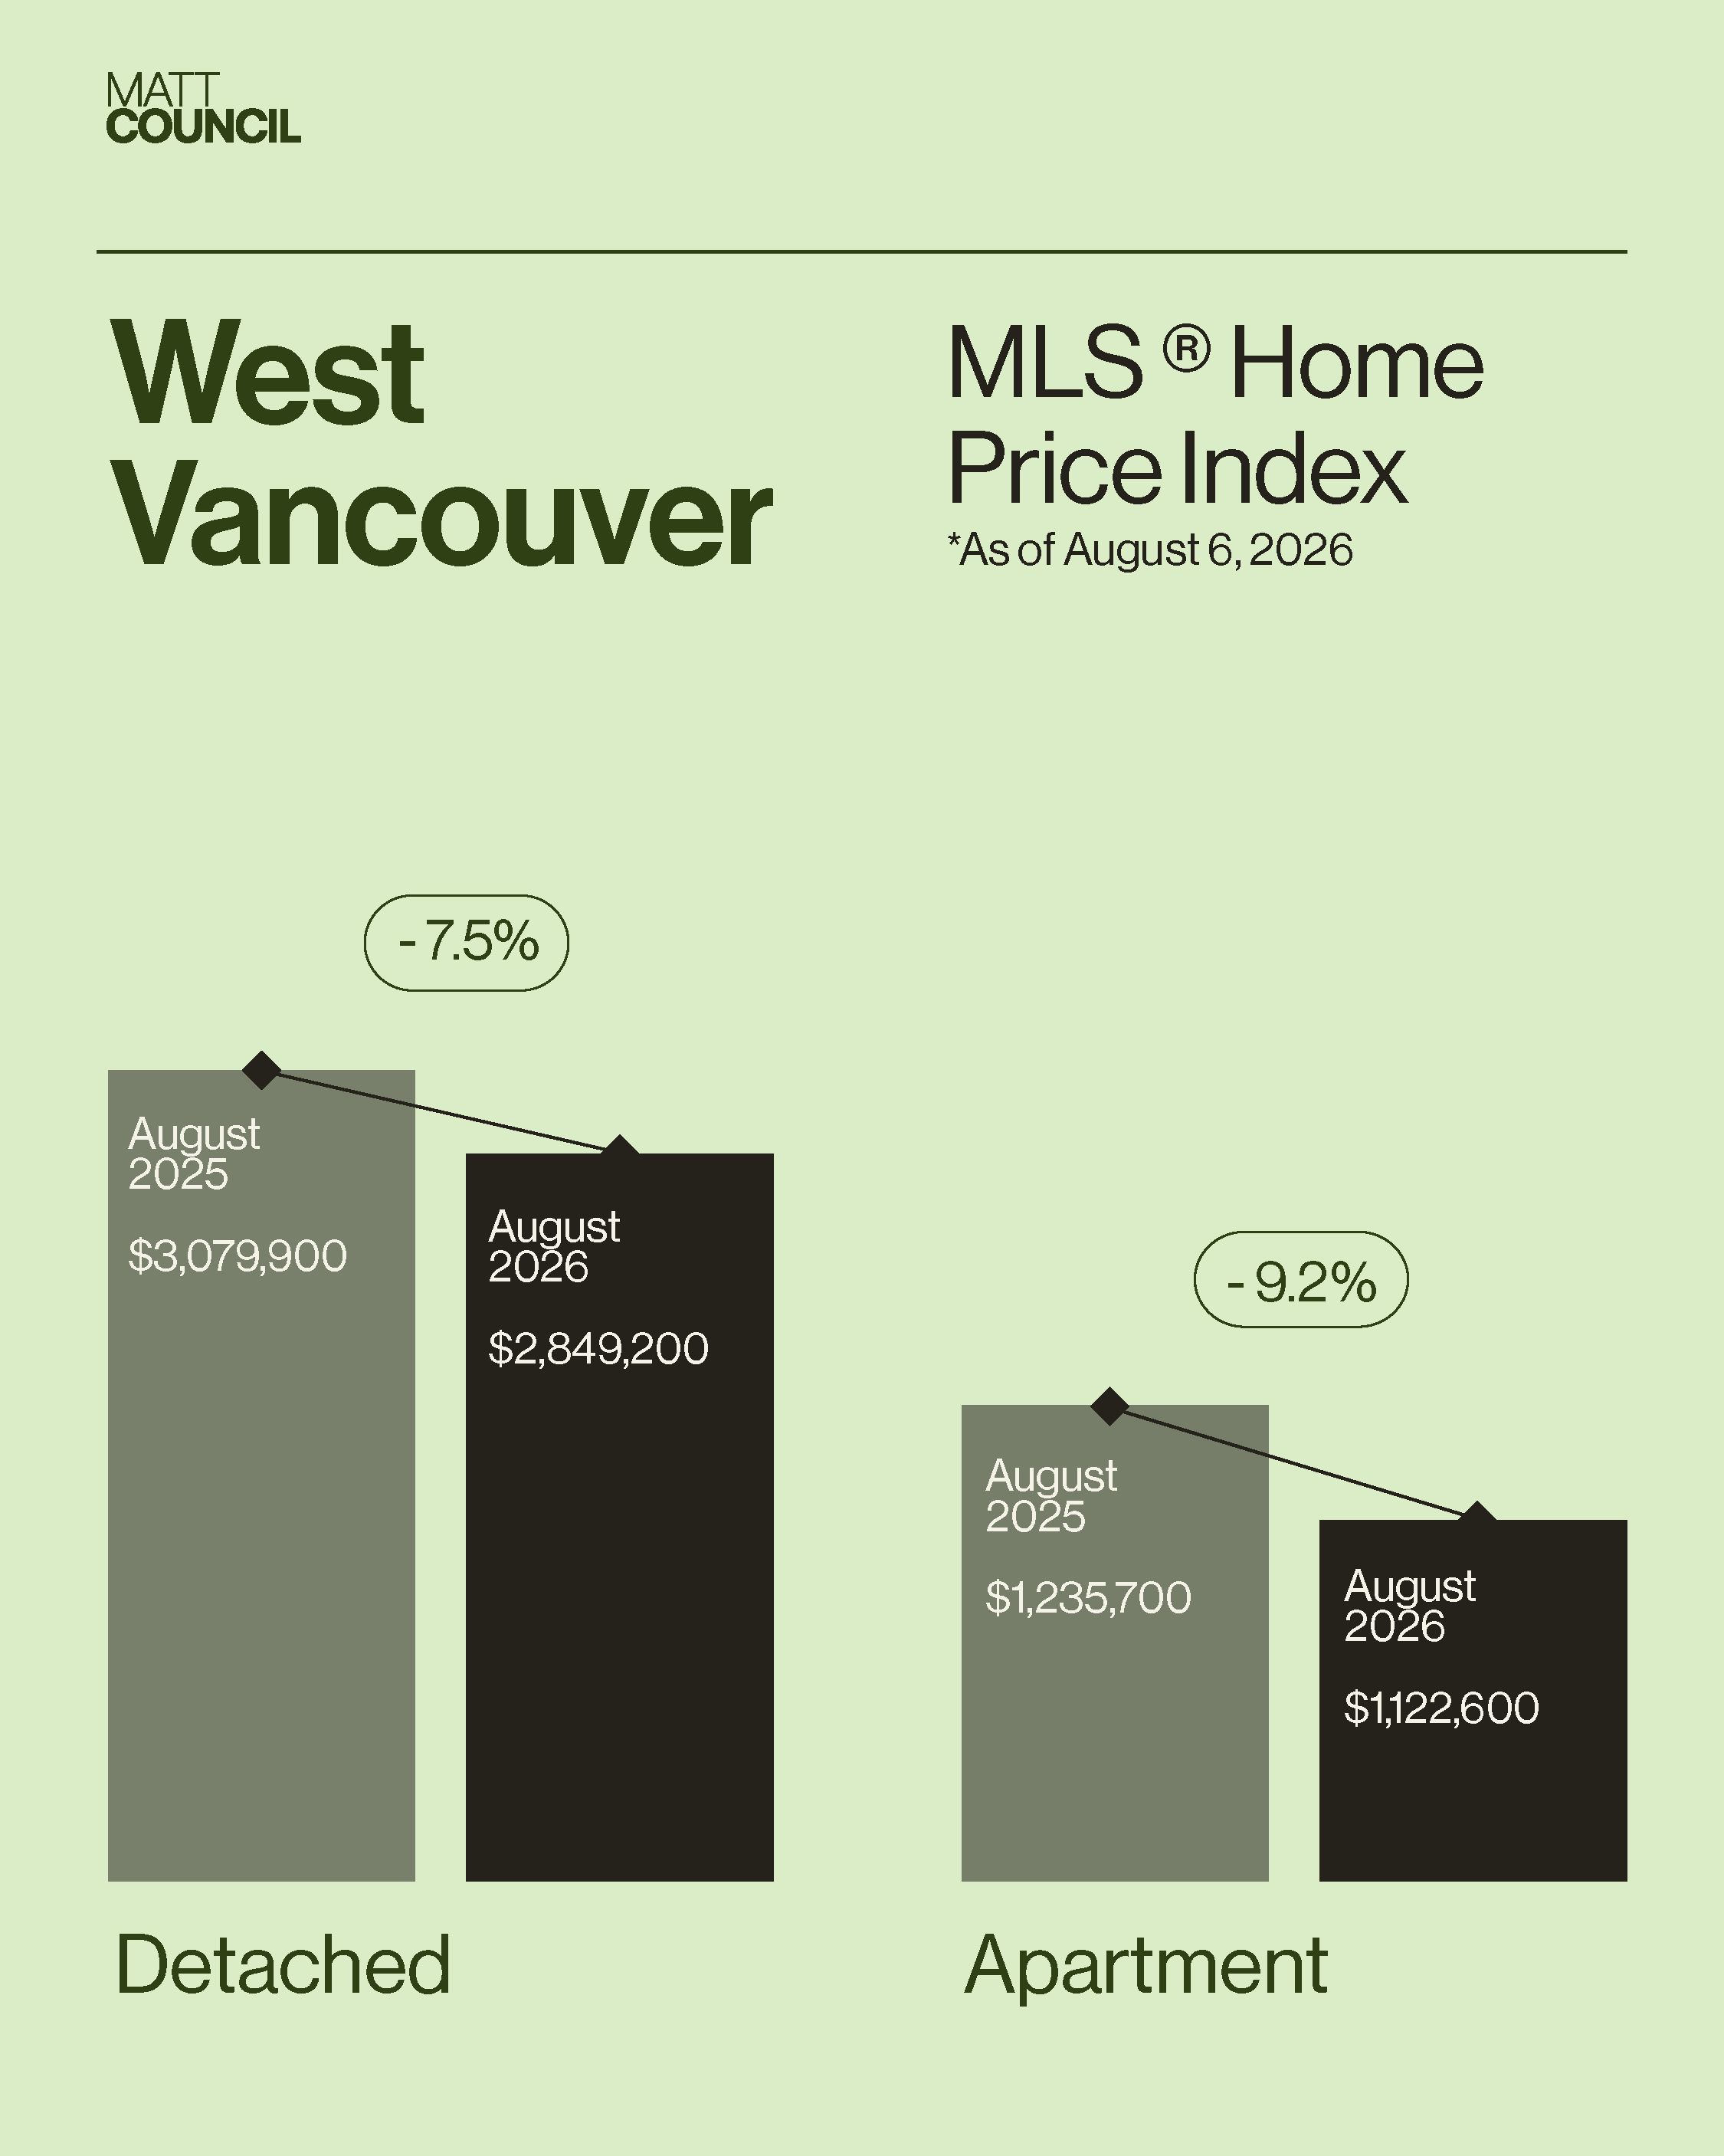
West Vancouver told a different story this month. Sales jumped 29.3% year over year to 53, and new listings rose a modest 3.6%, but total inventory still fell 11.6% to 656 active listings. That combination pushed the sales-to-active ratio to 8.1% from 5.5%, a 47.3% increase, though it remains in buyer-favouring territory. Homes sold faster than they did last August, 38 days on market versus 54, a 29.6% improvement, and the sale-to-original-list-price ratio softened to 92.8% from 94.9%, suggesting sellers are giving up more ground to get deals done. Benchmark pricing pulled back more sharply than in North Vancouver: houses down 7.5% to $2,849,200 and condos down 9.2% to $1,122,600. A reliable townhome benchmark wasn't available this month.
Why One Strong or Weak Month Doesn't Settle the Question
The bigger story this summer isn't any single month's number, it's how much those numbers have moved around from one month to the next. That volatility reflects a market where overall demand remains fairly thin, so the outcome for any individual property depends heavily on whether it happens to connect with the small pool of active, motivated buyers out there. Homes that do connect with a broad group of interested buyers can still generate real competition. Homes that don't can sit with little additional demand behind the first offer, which has made negotiations harder both on the way to an accepted offer and again once inspection or other subject conditions come into play.
West Vancouver's swing from a weak July into a strong August is a clean illustration of this. A jump like that can look like a turning point, but set against North Vancouver's flat, steady result in the same month, it reads more like the kind of month-to-month noise that has characterized the entire summer. The falling inventory numbers in both markets fit the same pattern: with fewer new listings coming to market and some sellers likely holding off until fall, a shrinking active count doesn't necessarily mean the supply-demand balance is genuinely tightening.
Break the numbers down by property type and the unevenness gets even sharper. North Vancouver townhomes are the standout, with their sales-to-active ratio climbing to 20.7% from 16% a year ago, well ahead of detached (13%, up from 11%) and apartments (14.7%, up from 14%). West Vancouver apartments told a similar story of a single segment pulling away from the rest, jumping to 15.1% from 9%, while detached homes there barely moved, at 6% versus 5%. That's the pattern behind this summer's inconsistent results: it's rarely the whole market moving together, it's one property type in one area finding real depth of demand while the rest stay quiet.
August 2026 Stats
North Vancouver
| Metric | Aug 2026 | Aug 2025 | % Chg |
|---|---|---|---|
| Sales | 139 | 137 | ▲ 1.5% |
| New Listings | 290 | 301 | ▼ 3.7% |
| Active Inventory | 903 | 1,029 | ▼ 12.2% |
| Sales-to-Active Ratio | 15.4% (Balanced) | 13.0% | ▲ 15.8% |
| Sale Price / Original List Price | 96.5% | 96.2% | ▲ 0.3% |
| Days on Market | 28 | 19 | ▲ 47.4% |
| MLS® HPI Price Detached | $2,088,400 | $2,165,600 | ▼ 3.6% |
| MLS® HPI Price Condo | $770,300 | $797,200 | ▼ 3.4% |
| MLS® HPI Price Townhome | $1,247,400 | $1,287,500 | ▼ 3.1% |
Sales-to-Active Ratio by Property Type: Detached 13% (up from 11%), Apartments 14.7% (up from 14%), Townhomes 20.7% (up from 16%)
West Vancouver
| Metric | Aug 2026 | Aug 2025 | % Chg |
|---|---|---|---|
| Sales | 53 | 41 | ▲ 29.3% |
| New Listings | 142 | 137 | ▲ 3.6% |
| Active Inventory | 656 | 742 | ▼ 11.6% |
| Sales-to-Active Ratio | 8.1% (Buyer Favouring) | 5.5% | ▲ 47.3% |
| Sale Price / Original List Price | 92.8% | 94.9% | ▼ 2.2% |
| Days on Market | 38 | 54 | ▼ 29.6% |
| MLS® HPI Price Detached | $2,849,200 | $3,079,900 | ▼ 7.5% |
| MLS® HPI Price Condo | $1,122,600 | $1,235,700 | ▼ 9.2% |
| MLS® HPI Price Townhome | n/a | n/a | -- |
Sales-to-Active Ratio by Property Type: Detached 6% (up from 5%), Apartments 15.1% (up from 9%)
Looking Ahead: Strategic Advice
September typically brings more listings back to market as sellers return from summer, and some of those sellers will also be buyers, adding activity on both sides. The real question is whether buyer demand grows to match the expected return of inventory, or whether more choice for buyers simply extends the cautious, selective conditions we've seen all summer.
For Sellers: North Vancouver's 15.4% sales-to-active ratio is balanced overall, but townhome sellers are in a noticeably stronger position at 20.7%, while detached and apartment sellers are working with a market that's balanced at best, and 28 days on market shows buyers are taking their time even on homes that do sell. In West Vancouver, an 8.1% ratio still favours buyers, and the softer 92.8% sale-to-list ratio suggests some room is being negotiated off asking, so realistic pricing and flexibility on terms will matter for a smooth sale, though apartment sellers there have more leverage than the headline number suggests, with that segment's ratio nearly doubling to 15.1%.
For Buyers: West Vancouver's faster 38-day average and buyer-favouring conditions mean there's still room to negotiate on detached homes, particularly with prices down 7.5% year over year, though West Van apartments are moving toward more competitive territory. In North Vancouver, detached and apartment buyers still have some breathing room, but townhome buyers should be ready to move decisively, that segment's demand has clearly outpaced the rest of the market this year.
Planning a move?
Every micro-neighbourhood and building on the North Shore is behaving differently right now. Whether you want to navigate current choices or need an accurate strategy to sell, I am here to help you translate the data.
Call/text or email me to book a 15-minute strategy session.
604-317-4464
Matt@RossettiRealty.ca

About Matt Council
Matt Council is a top-performing North Vancouver Realtor and West Van specialist with a background in finance. He moves beyond the sales hype to offer clients a data-driven, pressure-free approach to buying and selling real estate on the North Shore. Whether you are evaluating a presale in Lower Lonsdale or a detached home in Lynn Valley, Matt helps you understand the numbers behind the move.
Thinking of making a move? Let’s run the numbers.